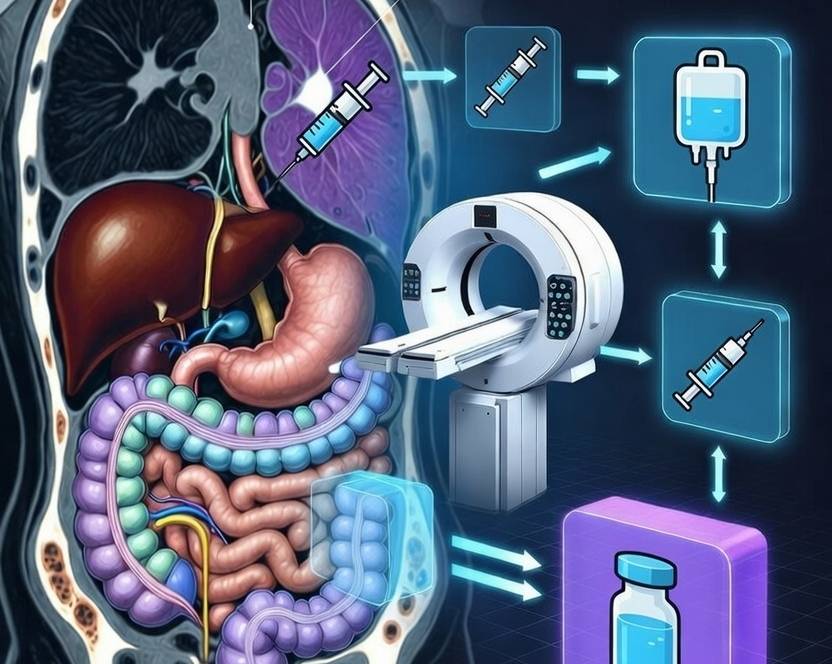
Master the renal mass MRI protocol with a step-by-step framework covering T2 HASTE and dynamic 3D T1 fat-saturated sequences, corticomedullary-to-excretory contrast timing, SAR-conscious sequence design, and the scanning, interpretive, and clinical pitfalls that most often derail accurate kidney lesion characterization.
Renal Mass MRI Protocol: The Complete Radiographer & Radiologist Guide
🧲 Sequences Used
- Axial/coronal T2 HASTE (SSFSE)
- Axial dual-echo in-phase/out-of-phase T1
- Coronal 3D T1 fat-saturated dynamic (LAVA/VIBE/THRIVE)
- Axial DWI (b=0, 400, 800 s/mm²)
💉 Contrast Protocol
10–15 mL (0.1 mmol/kg) gadolinium-based agent at 2.0 mL/s, followed by a 100 mL saline chaser at 2.0 mL/s. Acquired as a multiphasic dynamic series: corticomedullary (25–35 s), nephrographic (90–100 s), and excretory/delayed (3–5 min) phases.
🎯 Artifact Reduction
Primary artifact: chemical shift of the second kind (“India ink” boundary artifact). Remedy: recalculate the out-of-phase echo time per field strength (~1.1 ms increments at 3T vs. ~2.2 ms at 1.5T) so fat and water protons are genuinely 180° out of phase at acquisition.
⚠️ Key Pitfalls
- Radiographers: mis-set opposed-phase TE for field strength
- Radiologists: chemical shift signal drop mistaken for intracellular lipid
- Referrers: acting on an “indeterminate renal lesion” without Bosniak context
- Introduction
- Renal Anatomy Essentials
- MR Tissue Relaxation Values
- Scanning Technique — 10 Steps
- Contrast Media Protocol
- Specific Absorption Rate & Dose Reduction
- Top 10 Renal Pathologies
- Bosniak Classification: CT vs. MRI
- Renal Cell Carcinoma Subtypes
- Primary Reporting Frameworks
- Pitfalls — Radiographers
- Pitfalls — Radiologists
- Pitfalls — Non-Radiology Physicians
- Pitfall Comparison Summary
- AI & Automation in Renal MRI
- Further Reading
- Reducing Artefacts with Patients and Parameters
- Parallel Imaging Protocols and Parameters
- Conclusion
- References
Introduction
An optimized renal mass MRI protocol is one of the most consequential studies a body MRI service performs. Roughly half of adults over 50 have at least one incidentally detected renal lesion on cross-sectional imaging, and the difference between a technically sound multiphasic acquisition and a rushed, poorly timed one is frequently the difference between a confident Bosniak I discharge letter and an unnecessary biopsy or nephrectomy referral.
Kidney MRI occupies a unique niche relative to CT: it offers superior soft-tissue contrast resolution, avoids ionizing radiation, and — critically — allows confident lesion characterization in patients with contraindications to iodinated contrast or reduced renal function where CT dosing would otherwise be constrained. But it also introduces MRI-specific technical hazards that do not exist on CT, most notably chemical shift artifact, motion sensitivity of 3D fat-saturated sequences, and the need for meticulous bolus timing across three or more contrast phases within a single breath-hold-limited examination.
This guide walks through the complete kidney MRI workflow: the anatomy that dictates sequence planning, the relaxation values that explain tissue contrast behavior, a ten-step scanning technique, the dynamic contrast protocol, SAR-conscious parameter selection, the top ten pathologies the protocol is built to detect, and — most importantly for departmental quality — the distinct pitfalls that trip up radiographers at the console, radiologists at the workstation, and referring physicians acting on the report.
Standardize Contrast Delivery with SATline
Consistent, low-compliance high-pressure tubing supports reproducible corticomedullary and nephrographic phase timing across every renal MRI case.
Renal Anatomy Essentials
The kidneys are paired retroperitoneal organs lying between roughly T12 and L3, with the right kidney typically 1–2 cm lower than the left due to hepatic displacement. Each kidney is invested by a fibrous renal capsule, surrounded by perinephric fat, and enclosed within Gerota’s fascia — a compartment relevant to staging tumor extension. Understanding the internal zonal anatomy is the foundation of accurate dynamic contrast interpretation, because each zone enhances differently across the bolus.
Cortex
The renal cortex forms the outer 1 cm of parenchyma and contains the glomeruli and proximal/distal convoluted tubules. It is the most vascular renal compartment and therefore enhances earliest and most intensely — this is the physiological basis of the corticomedullary phase, acquired 25–35 seconds post-injection, during which the cortex is brightly enhancing while the medulla remains comparatively dark.
Medulla
The medulla comprises 8–18 renal pyramids containing the loops of Henle and collecting ducts, converging on the renal papillae. Medullary enhancement lags the cortex by roughly 60–90 seconds due to the countercurrent exchange system, becoming isointense to cortex during the nephrographic phase (90–100 seconds) — the phase most sensitive for detecting a subtle enhancing renal mass against homogeneously enhanced background parenchyma.
Collecting system and vasculature
Each renal pyramid drains into a minor calyx, multiple minor calyces unite into major calyces, and these converge on the renal pelvis before continuing as the ureter. The renal artery arises directly from the aorta and typically divides into anterior and posterior segmental branches before further subdividing into interlobar, arcuate, and interlobular arteries supplying the cortex. Venous drainage mirrors the arterial supply, with the left renal vein coursing anterior to the aorta and receiving the left gonadal and adrenal veins — an important anatomic landmark when assessing for tumor thrombus extension in renal cell carcinoma staging.
MR Tissue Relaxation Values
Understanding baseline T1 and T2 relaxation times of normal renal anatomy at 1.5T and 3T underpins correct sequence weighting and helps radiologists recognize when a signal characteristic deviates from expected normal tissue behavior — the essence of lesion characterization.
| Structure | T1 (ms) @ 1.5T | T1 (ms) @ 3T | T2 (ms) @ 1.5T | T2 (ms) @ 3T |
|---|---|---|---|---|
| Renal cortex | ~966 | ~1142 | ~87 | ~76 |
| Renal medulla | ~1272 | ~1545 | ~85 | ~81 |
| Renal sinus fat | ~260 | ~370 | ~65 | ~58 |
| Simple cyst fluid | ~2500–3000 | ~3000–3500 | >200 | >200 |
| Skeletal muscle (reference) | ~870 | ~1420 | ~47 | ~32 |
| Perinephric/retroperitoneal fat | ~240 | ~370 | ~60–70 | ~55–65 |
These values explain why the cortex is relatively hyperintense to medulla on T1-weighted precontrast imaging but the relationship reverses transiently during corticomedullary-phase enhancement, and why simple cysts — with long T1 and very long T2, similar to cerebrospinal fluid — appear uniformly dark on T1 and brilliantly hyperintense on T2 HASTE, the signature that anchors Bosniak category I assignment.
Scanning Technique — 10 Steps
- Patient preparation. Confirm fasting status (4 hours) to reduce bowel peristalsis artifact, screen renal function (eGFR) for gadolinium eligibility, and instruct on breath-hold technique — dynamic sequences depend entirely on breath-hold consistency across phases.
- Coil selection and positioning. Use a torso phased-array coil positioned to cover both kidneys plus the adrenal glands superiorly and bladder trigone inferiorly (for staging completeness), centered at the umbilicus.
- Localizer and coverage planning. Acquire a tri-plane localizer confirming both kidneys are within coil sensitivity and field of view; extend coronal FOV superiorly if adrenal or IVC extension is suspected.
- Axial and coronal T2 HASTE (SSFSE). Acquire fast single-shot T2 sequences with slice thickness ≤5 mm; these are largely motion-insensitive and establish baseline cyst/solid characterization and fluid signal.
- Dual-echo in-phase/out-of-phase T1. Acquire breath-hold gradient-echo T1 with paired in-phase and out-of-phase echo times, field-strength calibrated, to assess for intracellular lipid (angiomyolipoma vs. clear cell RCC signal drop).
- Precontrast 3D T1 fat-saturated. Establish a true baseline signal for subtraction imaging and enhancement quantification before any gadolinium is administered.
- Axial DWI. Acquire diffusion-weighted imaging (b=0, 400, 800 s/mm²) with corresponding ADC map generation to support solid-versus-cystic and benign-versus-malignant characterization.
- Multiphasic dynamic 3D T1 fat-saturated acquisition. Administer the gadolinium bolus and acquire the corticomedullary (25–35 s), nephrographic (90–100 s), and excretory/delayed (3–5 min) phases as separate breath-held or navigator-gated volumes.
- Post-processing subtraction. Generate subtraction images (postcontrast minus precontrast) for each dynamic phase to unmask true enhancement independent of intrinsic T1 hyperintensity (e.g., hemorrhagic cyst content).
- Delayed coronal T1 and quality review. Acquire a final coronal T1 fat-saturated delayed phase to assess collecting system opacification and confirm all target structures — kidneys, adrenals, retroperitoneal nodes — are within diagnostic-quality coverage before releasing the patient.
Scanner comparison table (1.5T vs. 3.0T)
| Parameter | 1.5T | 3.0T |
|---|---|---|
| In-phase / out-of-phase TE | ~4.4 ms / ~2.2 ms | ~2.2 ms / ~1.1 ms |
| SNR | Baseline | ~1.7–2× higher, traded for chemical shift/artifact sensitivity |
| Fat suppression uniformity | Generally more homogeneous | More susceptible to B0/B1 inhomogeneity, especially bilateral kidneys off-center |
| SAR headroom | Greater — fewer RF-limited sequence constraints | More restrictive; parallel imaging and reduced flip angles often required |
| Dynamic temporal resolution achievable | ~10–15 s per 3D phase (with acceleration) | ~7–12 s per 3D phase (with acceleration) |
Contrast Media Protocol
Renal mass characterization is fundamentally a dynamic contrast study — enhancement pattern and magnitude, not morphology alone, differentiate a Bosniak IIF cyst from a Bosniak III/IV lesion or a clear cell RCC from an oncocytoma or fat-poor angiomyolipoma.
- Volume: 10–15 mL (0.1 mmol/kg) gadolinium-based contrast agent
- Flow rate: 2.0 mL/s
- Chaser: 100 mL saline at 2.0 mL/s
- Acquisition: Multiphasic dynamic — corticomedullary (25–35 s), nephrographic (90–100 s), excretory/delayed (3–5 min)
A macrocyclic gadolinium-based contrast agent is preferred, particularly in patients with reduced eGFR, given the established association between linear agents and nephrogenic systemic fibrosis (NSF) in severe renal impairment. Current society guidance recommends eGFR screening prior to administration and macrocyclic-agent preference in patients with eGFR <30 mL/min/1.73m².
Precision-Filled Syringes with SATSyringe
Pre-filled, air-bubble-minimized syringes help hit the 25–35 second corticomedullary window consistently, phase after phase.
Specific Absorption Rate & Dose Reduction
Renal MRI’s reliance on fat-saturated 3D gradient-echo sequences and multiple dynamic phases makes SAR management a genuine practical constraint, particularly at 3T where RF deposition per unit tissue roughly quadruples relative to 1.5T for equivalent flip angles.
| Regulatory Body | Whole-body SAR limit (normal mode) | Relevance to renal protocol |
|---|---|---|
| ICRP | Guidance framework for RF exposure, not device-specific limits | Underpins general as-low-as-reasonably-achievable (ALARA) principle applied to RF as well as ionizing dose |
| IEC 60601-2-33 / adopted by EC RP 185 | 2 W/kg whole-body (normal operating mode) | Governs multi-phase abdominal dynamic sequences at 3T |
| AAPM | Practice guidance aligned with IEC limits; emphasizes local monitoring | Recommends departmental SAR auditing for high-duty-cycle abdominal protocols |
Five dose reduction strategies
- Reduce flip angle on fat-saturated 3D T1 sequences to the minimum required for adequate SNR, particularly at 3T.
- Employ parallel imaging (SENSE/GRAPPA) to shorten acquisition and reduce total RF pulses per phase.
- Use hybrid or SPAIR-based fat suppression rather than high-SAR spectral presaturation stacked with additional RF pulses.
- Extend TR modestly where breath-hold length permits, spreading RF deposition over time.
- Consolidate redundant sequences — e.g., using subtraction imaging rather than repeating full fat-saturated acquisitions at every possible delay.
Consistent Saline Chaser Dilution with SATMix
Standardized contrast-to-saline mixing supports reproducible enhancement across dynamic phases while keeping departmental SAR and dose protocols consistent.
Top 10 Renal Pathologies
Simple renal cyst (Bosniak I)
No enhancement on subtraction imaging; requires no follow-up.
Minimally complex cyst (Bosniak II/IIF)
Thin non-enhancing septa or minimal wall thickening; IIF requires surveillance MRI.
Complex cystic mass (Bosniak III)
Measurable enhancement of thickened irregular septa/wall; ~50% malignant — surgical or ablative referral.
Cystic renal cell carcinoma (Bosniak IV)
Enhancing soft-tissue component distinguishes from III; high malignancy probability.
Clear cell RCC
Avid, heterogeneous corticomedullary-phase enhancement — the classic hypervascular pattern.
Papillary RCC
Relatively hypovascular; low-level progressive enhancement, often multifocal.
Chromophobe RCC
Homogeneous, moderate enhancement; central scar can mimic oncocytoma.
Oncocytoma (benign)
Segmental enhancement inversion pattern reported; overlaps significantly with chromophobe RCC — biopsy often needed.
Angiomyolipoma (fat-containing)
India-ink/chemical-shift boundary at fat-soft tissue interface confirms macroscopic fat — diagnostic of benignity.
Fat-poor angiomyolipoma
Diagnostic overlap with clear cell RCC; homogeneous mild T2 hypointensity favors AML over RCC but is not definitive.
Confident Renal Mass Characterization Starts with SATline
Reliable, kink-resistant contrast delivery lines are what separate a diagnostic multiphasic timing sequence from an indeterminate report.
Bosniak Classification: CT vs. MRI
The Bosniak classification was originally developed in 1986 using contrast-enhanced CT, and for nearly three decades it functioned as a CT-native system that radiologists applied to MRI studies by analogy rather than by validated equivalence. The Bosniak v2019 revision changed this: it introduced modality-specific criteria that formally acknowledge CT and MRI do not see the same lesion the same way, and that a category assigned on one modality cannot always be assumed to transfer directly to the other.
On CT, category assignment leans heavily on measured attenuation change in Hounsfield units, with an enhancement threshold of roughly 15–20 HU generally accepted as diagnostic of true enhancement. MRI has no directly equivalent absolute unit — signal intensity is not quantitatively standardized across scanners the way Hounsfield units are — so MRI-specific Bosniak criteria instead depend on relative, visually or semi-quantitatively assessed enhancement on subtraction imaging, typically expressed as “perceptible enhancement” of a septum or wall compared with an adjacent unenhanced reference structure such as psoas muscle or renal cortex.
This distinction has real consequences. MRI’s superior soft-tissue contrast resolution and lack of beam-hardening artifact make it more sensitive to thin septa and subtle wall irregularity than CT, which means a lesion categorized as Bosniak II on CT is not infrequently upgraded to Bosniak IIF or even III when the same lesion is subsequently imaged with MRI — not because the lesion has changed, but because MRI is detecting architectural complexity that CT physically could not resolve. Conversely, T2 hyperintense septa that appear thickened on a single HASTE sequence can sometimes overcall complexity that dynamic post-contrast imaging does not confirm as true enhancing tissue, so MRI Bosniak assignment must always integrate precontrast T1/T2 morphology with genuine, subtraction-confirmed dynamic enhancement rather than either data source in isolation.
Another structural difference is how each modality handles the “IIF” category — lesions that are minimally complex but not benign enough for immediate discharge, requiring surveillance. Because MRI more frequently identifies thin septa, MRI-based IIF assignment has a somewhat different malignancy prevalence profile than CT-based IIF assignment in published series, and the v2019 update’s separate MRI-specific decision points (assessing predominantly the number and thickness of septa, plus the presence or absence of measurable enhancement) were calibrated specifically to keep MRI’s higher lesion conspicuity from systematically over-upgrading benign complexity into unnecessary surgical referral.
For departments running both CT and MRI renal mass protocols, the practical takeaway is threefold: apply the modality-appropriate Bosniak v2019 criteria rather than a single unified checklist; document which modality generated the category in every report; and default to same-modality comparison for surveillance unless there is a specific clinical reason to switch — most commonly reduced renal function precluding iodinated contrast, or an equivocal enhancement call on CT that MRI’s superior contrast resolution can resolve.
Renal Cell Carcinoma Subtypes
Renal cell carcinoma is not a single disease but a family of histologically and molecularly distinct tumors that share a common anatomic origin in the renal tubular epithelium yet behave very differently on imaging, in clinical course, and in response to therapy. Recognizing the imaging phenotype of the major RCC subtypes is central to pretreatment risk stratification, and increasingly informs whether a patient is offered active surveillance, partial nephrectomy, ablation, or systemic therapy.
Clear cell RCC (ccRCC)
Clear cell RCC accounts for roughly 70–75% of renal cell carcinomas and is the subtype most strongly associated with the classic hypervascular imaging phenotype: avid, heterogeneous corticomedullary-phase enhancement that washes out relative to normal parenchyma on later phases, frequently with intratumoral microscopic fat/lipid content producing signal drop on opposed-phase imaging, and a propensity for necrosis, hemorrhage, and calcification in larger lesions. ccRCC carries the highest metastatic potential of the common subtypes and is the tumor type the ccLS scoring system (discussed below) was specifically designed to flag.
Papillary RCC
Papillary RCC is the second most common subtype (10–15%) and is relatively hypovascular compared with ccRCC, typically showing homogeneous, low-level, progressive enhancement well below cortical enhancement on every phase. It is frequently multifocal or bilateral, particularly in hereditary papillary renal carcinoma syndrome, which makes the systematic whole-kidney review discussed in the radiologist pitfalls section especially important for this subtype. Type 1 papillary RCC tends to be indolent; type 2 carries a worse prognosis and can show more heterogeneous, higher-grade imaging features.
Chromophobe RCC
Chromophobe RCC (5%) shows homogeneous, moderate enhancement intermediate between ccRCC and papillary RCC, often with a “spoke-wheel” enhancement pattern and a central scar that can closely mimic oncocytoma — the overlap is significant enough that imaging alone frequently cannot reliably distinguish the two, and this pair remains one of the most persistent diagnostic dilemmas in renal mass imaging, often necessitating percutaneous biopsy.
Collecting duct and medullary RCC
These rare, aggressive subtypes arise from the collecting ducts and renal medulla respectively, present as infiltrative, poorly marginated masses with irregular enhancement, and are associated with early metastatic spread. Medullary RCC occurs almost exclusively in patients with sickle cell trait and should be specifically considered in that population presenting with a rapidly growing, centrally located renal mass.
Translocation-associated RCC
An increasingly recognized subtype driven by MiT family gene fusions, translocation RCC occurs more frequently in younger patients and children and can mimic either ccRCC or papillary RCC on imaging, reinforcing that definitive subtyping ultimately requires histopathologic and, increasingly, molecular confirmation rather than imaging phenotype alone — imaging’s role is to characterize, stage, and guide biopsy or surgical planning, not to replace tissue diagnosis for indeterminate solid lesions.
Reliable Enhancement Data for Subtype Differentiation
Distinguishing hypervascular ccRCC from hypovascular papillary RCC depends on trustworthy phase-to-phase contrast delivery — SATMix keeps every dilution consistent.
Primary Reporting Frameworks in Renal Mass Imaging
Beyond Bosniak categorization of cystic lesions, radiology has developed several complementary structured reporting frameworks that standardize how solid renal masses, bladder tumors, and surgical complexity are described. Structured frameworks reduce interobserver variability, give referring clinicians language they can act on consistently, and increasingly feed directly into AI-assisted quantification tools. The four frameworks below represent the current backbone of genitourinary structured reporting relevant to a renal mass MRI protocol.
Bosniak Classification (Cystic Masses)
The Bosniak classification remains the gold standard for stratifying the malignancy risk of complex and simple renal cystic masses on both CT and MRI, and — as detailed in the dedicated section above — was substantially revised in 2019 to formalize modality-specific criteria. Category I describes a definitively benign simple cyst: thin, hairline wall, homogeneous fluid signal, no septa, no calcification, and no measurable enhancement. Category II includes minimally complex cysts with a few thin (≤2 mm) septa or fine calcification, still requiring no follow-up. Category IIF (“F” for “follow-up”) introduces genuine uncertainty — more numerous thin septa, minimal smooth wall or septal thickening, or perceived rather than measured enhancement — and mandates structured surveillance imaging, typically at 6 and 12 months and then annually if stable, most protocols settling on a total surveillance period of roughly five years before a lesion can be considered stable long-term.
Category III describes an indeterminate cystic mass with thickened, irregular walls or septa demonstrating measurable enhancement; roughly half of Bosniak III lesions prove malignant at resection, and current guidance supports either surgical excision, thermal ablation, or active surveillance depending on patient comorbidity and preference, reflecting genuine equipoise at this category. Category IV describes a clearly malignant cystic renal mass with all the features of category III plus an enhancing soft-tissue component distinct from the wall or septa — these lesions are managed as renal cell carcinoma regardless of their cystic component.
The v2019 revision’s most consequential change for MRI practice was formalizing “enhancement” as a category-defining feature that must be assessed on dedicated subtraction imaging or, where subtraction is unavailable or unreliable due to motion, on meticulous side-by-side comparison of matched precontrast and postcontrast source images — a direct link to the subtraction misregistration pitfall discussed elsewhere in this guide. The framework also formally incorporated diffusion-weighted imaging as an ancillary — not category-defining — feature that can raise or lower confidence at the margins between adjacent categories, particularly the III/IV boundary.
From a departmental workflow perspective, Bosniak reporting works best when built into a structured template that forces explicit documentation of septa number and thickness, wall characteristics, calcification, and a discrete enhancement determination (present/absent/equivocal) rather than free-text narrative impression — templates of this kind are strongly associated with improved interobserver agreement in published validation studies and reduce the anchoring bias risk described in the radiologist pitfalls section, because the template compels systematic feature-by-feature review rather than a single holistic gestalt call.
ccLS (Clear Cell Likelihood Score)
The Clear Cell Likelihood Score is a newer, purpose-built multiparametric MRI scoring algorithm developed specifically for solid renal masses without macroscopic fat — the population Bosniak was never designed to address, since Bosniak applies to cystic rather than solid lesions. Where Bosniak asks “how malignant is this cystic lesion,” ccLS asks a narrower and clinically distinct question: “how likely is this solid, fat-free renal mass to be clear cell RCC specifically” — the subtype with the highest metastatic potential and the one most amenable to targeted systemic therapy if it does progress.
ccLS integrates three multiparametric MRI domains into a structured 1–5 score. First, T2-weighted signal characteristics: ccRCC tends to be T2 hyperintense relative to renal cortex, while papillary and chromophobe subtypes tend toward T2 hypo- to isointensity — this single feature carries substantial discriminating weight in the algorithm. Second, degree of corticomedullary-phase enhancement relative to renal cortex: ccRCC’s hypervascularity produces enhancement approaching or exceeding cortex, whereas papillary RCC’s relative hypovascularity produces enhancement well below cortex. Third, signal drop on chemical-shift (opposed-phase) imaging, reflecting the microscopic intracytoplasmic lipid and glycogen characteristic of clear cell histology — the same chemical shift phenomenon that, as discussed extensively in the pitfalls sections of this guide, can also occur in fat-poor angiomyolipoma and must be interpreted in the full multiparametric context rather than in isolation.
A score of ccLS 5 indicates high confidence the mass is clear cell RCC; a score of ccLS 1 indicates high confidence it is not. Scores of 2–4 reflect genuine indeterminacy where biopsy remains the appropriate next step. Early multicenter validation work has reported that ccLS 4–5 masses carry a substantially higher probability of clear cell histology at resection than lower-scored masses, and — critically for clinical workflow — that ccLS 1–2 masses are disproportionately likely to represent papillary RCC, chromophobe RCC, or oncocytoma, subtypes for which active surveillance is increasingly considered a reasonable initial management strategy in appropriately selected patients, particularly for small (<3 cm) masses in older or comorbid patients.
Implementing ccLS successfully depends entirely on protocol adherence: it requires a dedicated multiparametric acquisition with precontrast T1, T2, in/out-of-phase imaging with field-strength-correct echo times, and a genuine corticomedullary-phase dynamic acquisition timed to the 25–35 second window — every element already built into the renal mass MRI protocol described in this guide. Departments adopting ccLS reporting should build a structured template mirroring the three-domain scoring logic directly into the PACS/RIS reporting macro, both to improve consistency and to generate the structured data increasingly expected by AI-assisted quantification tools referenced in the automation section above.
VI-RADS (Vesical Imaging-Reporting and Data System)
VI-RADS was developed for a different organ — the urinary bladder — but is closely related to the renal mass MRI protocol both anatomically (the collecting system and bladder share direct continuity with the kidney via the ureters) and technically (VI-RADS relies on the same multiparametric MRI building blocks — T2-weighted imaging, DWI/ADC, and dynamic contrast-enhanced imaging — that underpin renal mass characterization). It is included here because departments performing renal mass MRI frequently encounter incidental bladder findings, and because urothelial carcinoma can arise anywhere along the urinary tract, including the renal pelvis, making familiarity with VI-RADS logic directly relevant to comprehensive genitourinary reporting.
VI-RADS scores bladder tumors on a five-point scale assessing the likelihood of muscle-invasive disease, the single most important determinant of whether a bladder cancer is managed with organ-preserving transurethral resection or radical cystectomy plus systemic therapy. The score integrates T2-weighted assessment of the muscularis propria for interruption of the low-signal muscle layer, DWI/ADC assessment of restricted diffusion extending into or through the muscle layer, and dynamic contrast-enhanced imaging assessing early enhancement of the tumor stalk relative to the bladder wall. VI-RADS 1–2 indicates a low likelihood of muscle invasion, appropriate for organ-preserving management; VI-RADS 4–5 indicates a high likelihood of muscle-invasive disease, prompting more aggressive staging and treatment planning; VI-RADS 3 represents genuine equivocation requiring multidisciplinary discussion.
For the renal mass protocol specifically, the practical relevance of VI-RADS is coverage planning: extending the field of view inferiorly to include the bladder trigone — already recommended in the ten-step scanning technique above — means an incidental bladder lesion identified on a renal mass study can be preliminarily characterized using VI-RADS logic at the same sitting, rather than requiring a separate dedicated bladder MRI referral and an additional delay in the patient’s diagnostic pathway. Radiologists reporting renal mass MRI should maintain basic VI-RADS fluency for exactly this reason, even in departments where dedicated bladder MRI is performed by a different subspecialty team.
RENAL Nephrometry Scoring System
Where Bosniak and ccLS answer “what is this mass,” the RENAL Nephrometry Scoring System answers a different question entirely: “how anatomically complex is this mass to remove or ablate.” It is a surgical-planning tool, not a malignancy-risk tool, and its output directly informs whether a solid renal mass is a good candidate for nephron-sparing partial nephrectomy, percutaneous ablation, or requires radical nephrectomy — decisions made jointly by urology and interventional radiology, drawing directly on the same MRI dataset acquired for diagnostic characterization.
RENAL is an acronym describing five objectively scored anatomic parameters, each contributing 1–3 points to a total score ranging from 4–12. R (Radius) scores maximum tumor diameter, with smaller tumors scoring lower. E (Exophytic/endophytic properties) scores how much of the tumor projects beyond the normal renal contour versus how deeply it is buried within the parenchyma — a purely exophytic tumor is technically simpler to resect than a fully endophytic one. N (Nearness to the collecting system or sinus) scores the minimum distance from the tumor to the collecting system in millimeters, since proximity increases the risk of urine leak or collecting-system injury during resection. A (Anterior/posterior location) is a descriptor (not typically scored numerically in the total) that helps surgical approach planning. L (Location relative to the polar lines) scores whether the tumor is entirely above/below the polar lines, crosses a polar line, or crosses the axial renal midline, since a purely polar tumor is more amenable to a simple partial nephrectomy than one crossing the renal hilum.
A total RENAL score of 4–6 is generally considered “low complexity,” 7–9 “moderate complexity,” and 10–12 “high complexity” — with higher scores associated in published series with longer operative time, greater blood loss, higher complication rates, and reduced likelihood of successful nephron-sparing surgery. For percutaneous ablation candidates specifically, tumor proximity to the collecting system and to bowel (an additional consideration beyond the core RENAL parameters in some modified scoring variants) directly affects the feasibility and safety of thermal ablation, since injury to adjacent structures is a primary procedural risk.
Generating an accurate RENAL score depends entirely on the same high-spatial-resolution, multiplanar dataset produced by a well-executed renal mass MRI protocol — thin-slice coronal and axial 3D T1 fat-saturated dynamic imaging in particular, since precise measurement of tumor-to-sinus distance and polar-line relationship requires genuine multiplanar reconstructable data rather than thick, gapped acquisitions. Radiologists reporting a solid renal mass intended for surgical or ablative planning should include the RENAL score explicitly in the structured report rather than leaving urology to calculate it independently from the images — doing so both saves clinical time and reduces measurement discrepancy between specialties.
Pitfalls — Radiographers
Primary scanning pitfall (from protocol data): Chemical shift artifact of the second kind (“India ink” artifact) caused by failing to recalculate the out-of-phase echo time for the actual field strength in use.
| Category | Description | Mitigation |
|---|---|---|
| Chemical shift TE miscalculation | Applying a 1.5T opposed-phase TE value (~2.2 ms) on a 3T system, where the correct opposed-phase interval is closer to 1.1 ms, produces an incomplete or exaggerated boundary artifact and unreliable fat signal drop assessment. | Confirm field-strength-specific TE presets are loaded automatically by the sequence card; manually verify opposed-phase TE = 1/(2×Δf) for the scanner’s actual fat-water frequency shift. |
| Inconsistent breath-hold depth across dynamic phases | Corticomedullary, nephrographic, and excretory phases acquired at different lung volumes cause slice misregistration and unreliable subtraction imaging. | Coach patients with a standardized breath-hold instruction (“breathe in, breathe out, hold”) repeated identically before every phase; consider navigator-gated free-breathing acquisition in patients who cannot reliably comply. |
| Coil and FOV under-coverage | Tight FOV centered only on the kidneys misses adrenal or nodal extension relevant to staging. | Extend coronal FOV to include adrenal glands superiorly and aortic bifurcation inferiorly by protocol default. |
| Bolus-phase mistiming | Manual phase triggering without bolus tracking risks missing the narrow 25–35 second corticomedullary window. | Use automated bolus-triggering software or test-bolus timing rather than fixed time-delay estimation. |
| Incomplete fat suppression on dynamic 3D T1 | B0 inhomogeneity at kidney level (adjacent to bowel gas) causes patchy fat suppression failure that can mimic enhancement asymmetry. | Use shimming optimized to the renal region specifically, or switch to a Dixon-based water-fat separation technique less sensitive to B0 inhomogeneity. |
Pitfalls — Radiologists
Primary interpretation pitfall (from protocol data): Misreading chemical-shift-related signal drop on opposed-phase imaging as diagnostic of a benign, fat-containing angiomyolipoma, when clear cell RCC can produce a similar — though typically less homogeneous — signal drop due to microscopic intracellular lipid and glycogen.
| Pitfall | Mechanism | Consequence | Mitigation |
|---|---|---|---|
| Opposed-phase signal drop misattribution | Both fat-poor AML and clear cell RCC can show intravoxel fat/lipid causing opposed-phase signal loss; the finding alone does not confirm benignity. | Fat-poor AML mischaracterized as benign when it is malignant RCC, or vice versa, delaying appropriate management. | Corroborate with dedicated fat-suppressed sequences for macroscopic fat, T2 signal homogeneity, and enhancement pattern before committing to a diagnosis; recommend biopsy when equivocal. |
| Underestimating enhancement due to poor subtraction registration | Motion between precontrast and postcontrast acquisitions causes misregistration artifact on subtraction images that mimics or masks true enhancement. | False-negative or false-positive enhancement calls, altering Bosniak category. | Visually inspect pre- and post-subtraction source images directly rather than relying on subtraction alone; consider quantitative ROI enhancement thresholds (typically >15 HU-equivalent signal increase). |
| Bosniak category anchoring bias | Once an initial category is mentally assigned from the first phase reviewed, subsequent phases are interpreted to confirm rather than challenge that impression. | Under- or over-staging of complex cystic lesions. | Systematically review all three dynamic phases plus precontrast and DWI before finalizing a category, using a structured Bosniak v2019 checklist. |
| Missing small satellite or multifocal lesions | Attention concentrated on the dominant/index mass can cause smaller synchronous lesions (common in papillary RCC and hereditary syndromes) to be overlooked. | Incomplete staging and missed multifocal disease relevant to surgical planning. | Perform a systematic zone-by-zone parenchymal review on every phase, not only around the index lesion. |
Pitfalls — Non-Radiology Physicians
| Pitfall | What they see | What it actually is | Clinical danger | What to do |
|---|---|---|---|---|
| “Indeterminate renal lesion” phrase acted on without context | A report stating the lesion is “indeterminate” | Often a Bosniak IIF lesion requiring structured surveillance, not immediate intervention | Unnecessary urgent urology referral or, conversely, the lesion is lost to follow-up because urgency wasn’t conveyed | Read the full Bosniak category and recommended follow-up interval before triaging; contact radiology if unclear |
| Ordering contrast-enhanced MRI without eGFR check | A standing order for “renal mass MRI with contrast” | A patient with unrecognized eGFR <30 at meaningful NSF risk with linear agents | Avoidable NSF risk in vulnerable patients | Confirm recent eGFR before ordering; flag reduced renal function to radiology so a macrocyclic agent is used |
| Interpreting “no enhancement” as “definitely benign” for all lesion types | A cystic lesion reported as non-enhancing | Correct for simple/Bosniak II cysts, but hemorrhagic or proteinaceous cyst content can mimic non-enhancement on source images without subtraction confirmation | False reassurance if the underlying subtraction methodology wasn’t applied | Trust the radiologist’s stated Bosniak category rather than re-interpreting raw enhancement language independently |
| Assuming MRI and CT Bosniak categories are interchangeable | A prior CT-based Bosniak category compared directly to a new MRI report | MRI v2019 criteria assign categories differently than CT in some cases (MRI can upgrade lesions CT would call simple) | Confusing “progression” that is actually a modality-based reclassification, prompting unnecessary anxiety or intervention | Request same-modality comparison when possible, and ask radiology to clarify whether a category change reflects true progression |
Reduce Repeat Scans with SATSyringe
Consistent, accurately dosed contrast delivery reduces mistimed or incomplete phases that lead to ambiguous “indeterminate lesion” reports.
Pitfall Comparison Summary
🟡 Scanning (Radiographers)
- Wrong opposed-phase TE for field strength
- Inconsistent breath-hold depth
- Under-coverage of adrenals/nodes
- Bolus-phase mistiming
- Patchy fat suppression
🔴 Interpretation (Radiologists)
- Signal-drop misattribution (AML vs. RCC)
- Subtraction misregistration errors
- Bosniak anchoring bias
- Missed satellite lesions
🟣 Clinical (Physicians)
- Acting on “indeterminate” without context
- Ordering contrast without eGFR check
- Over-reassurance from “no enhancement”
- Cross-modality Bosniak confusion
AI & Automation in Renal MRI
Artificial intelligence is increasingly embedded in renal MRI workflows, from automated bolus-tracking and motion-corrected reconstruction to lesion segmentation tools that quantify enhancement across dynamic phases. Several FDA-cleared and CE-marked software platforms now assist with kidney volumetry, automated Bosniak-relevant enhancement quantification, and structured reporting templates that reduce the anchoring bias described above by prompting systematic review of all phases before a category is finalized.
These tools do not replace radiologist judgment on the genuinely difficult fat-poor AML versus RCC distinction, but evidence increasingly supports their role in reducing interobserver variability for Bosniak categorization and in flagging subtle enhancement that might otherwise be missed on a busy reporting list.
Consistent Inputs Make Better Outputs — SATMix
Whatever quantification or reporting software your department uses, standardized contrast mixing keeps the enhancement data feeding it reliable.
Further Reading
- CT Renal Mass Protocol: 7 Steps to Nail the Triple-Phase Scan
- 2026 Contrast Media Guidelines: eGFR Thresholds & Safe Administration Protocol
- 7 Proven Strategies for Optimizing MRI Sequences in 2026
- Radiology Workflow Optimization 2026: Solving Staff Shortages with AI & Agentic Systems
- Scaling Radiology AI 2026: Moving from Pilot Projects to Core Infrastructure
Reducing Artefacts with Patients and Parameters
The most critical scanning parameters that impact image quality in renal MRI fall into four interlocking categories: spatial resolution, signal-to-noise ratio, image contrast, and artifact control. Each involves a trade-off that radiographers must balance in real time against breath-hold constraints.
Spatial resolution
Matrix size (frequency × phase) governs the ability to resolve small structures — increasing matrix improves spatial resolution but reduces voxel size and therefore SNR. Field of view (FOV) works inversely: reducing FOV increases effective resolution but again shrinks voxel size and SNR. Slice thickness follows the same pattern — thinner slices reduce partial volume averaging and improve resolution of small renal masses but come at a significant SNR cost, particularly relevant for the thin-septa assessment central to Bosniak categorization.
Signal-to-noise ratio (SNR)
Number of averages (NEX/NSA) improves SNR by repeated data acquisition but proportionally lengthens scan time — often incompatible with single breath-hold dynamic phases. Receiver bandwidth reduction boosts SNR by limiting recorded noise bandwidth, but lowers scan speed and increases chemical shift artifact — a direct tension with the chemical-shift-sensitive nature of renal mass characterization. Coil selection matters enormously: a dedicated torso phased-array coil positioned close to the kidneys captures substantially stronger signal than a body coil alone.
Image contrast
Repetition time (TR) and echo time (TE) jointly determine T1 versus T2 weighting — short TR/TE for T1-weighted dynamic sequences maximizes the corticomedullary enhancement contrast central to this protocol, while long TE T2 HASTE sequences maximize fluid conspicuity for cyst characterization. Flip angle adjustments in the 3D gradient-echo dynamic sequences directly modulate enhancement contrast and SAR simultaneously.
Artifact control
Phase-encoding direction selection allows motion artifact from respiration or bowel peristalsis to be shifted away from the kidneys rather than superimposed on them. Respiratory gating or navigator triggering minimizes ghosting in patients unable to sustain reliable breath-holds. Parallel imaging reduces the number of phase-encoding steps required, cutting acquisition time and correspondingly reducing motion sensitivity across the multiphasic dynamic series — directly mitigating the breath-hold inconsistency pitfall discussed above.
Parallel Imaging Protocols and Parameters
Parallel imaging acceleration (SENSE, GRAPPA, or vendor equivalents) is essential to fitting a full multiphasic renal dynamic series into achievable breath-hold windows. Turbo/echo-train factor selection interacts directly with acceleration factor, echo spacing, and achievable spatial resolution.
| Sequence | Parameter | 1.5T typical setting | 3.0T typical setting | Adjustment for optimal quality |
|---|---|---|---|---|
| T2 HASTE | Turbo factor (echo train length) | 128–160 | 128–160 | Reduce TE and increase parallel imaging factor at 3T to offset increased specific absorption rate from higher effective RF duty cycle |
| Dynamic 3D T1 FS | Acceleration (SENSE/GRAPPA) factor | 2× | 2–3× (with SAR headroom permitting) | Increase acceleration at 3T primarily to shorten breath-hold, not solely for SAR — pair with a modest flip angle reduction |
| DWI (EPI) | Parallel imaging factor | 2× | 2–3× | Higher factor at 3T reduces geometric distortion from the more pronounced susceptibility effects at higher field |
| In/out-of-phase T1 GRE | Turbo factor | 1 (single echo pairs, low turbo) | 1 (single echo pairs, low turbo) | Turbo factor kept minimal regardless of field strength to preserve precise, field-calibrated echo timing |
As a general principle: increasing turbo factor shortens acquisition and reduces motion sensitivity but blurs fine anatomic detail and can exaggerate T2 decay-related blurring in HASTE sequences — a meaningful concern when assessing thin cyst septa. The optimal balance for renal mass protocols favors moderate turbo factors with higher parallel imaging acceleration rather than pushing turbo factor to its maximum, preserving the spatial detail Bosniak categorization depends on.
Conclusion
A technically sound renal mass MRI protocol rests on four pillars: anatomically informed sequence planning across T2 HASTE, in/out-of-phase T1, and multiphasic dynamic 3D T1 fat-saturated acquisitions; field-strength-calibrated chemical shift technique to avoid the “India ink” artifact that undermines fat-content assessment; SAR-conscious parameter selection that respects both patient safety and diagnostic quality; and — perhaps most importantly — awareness of the distinct pitfall patterns that affect radiographers at acquisition, radiologists at interpretation, and referring physicians acting on the final report.
From simple Bosniak I cysts requiring no further action through to cystic and solid renal cell carcinoma subtypes with genuinely overlapping imaging features, the protocol’s diagnostic power depends on disciplined execution of every dynamic phase and a structured, bias-resistant interpretive framework. Departments that standardize bolus timing, echo calibration, and reporting templates consistently produce more actionable, less ambiguous renal mass reports — sparing patients unnecessary anxiety, repeat imaging, and invasive workup.
References
- American College of Radiology. (2023). ACR manual on contrast media (Version 2023). American College of Radiology. acr.org/Clinical-Resources/Contrast-Manual
- Silverman, S. G., Pedrosa, I., Ellis, J. H., Hindman, N. M., Schieda, N., Smith, A. D., Remer, E. M., Shinagare, A. B., Curci, N. E., Raman, S. S., Wells, S. A., Kaffenberger, S. D., Wang, Z. J., Chandarana, H., & Israel, G. M. (2019). Bosniak classification of cystic renal masses, version 2019: An update proposal and needs assessment. Radiology, 292(2), 475–488. https://doi.org/10.1148/radiol.2019182646
- Schieda, N., Davenport, M. S., Krishna, S., Edney, E. A., Pedrosa, I., Hindman, N., Baroni, R. H., Hodgdon, T., & Silverman, S. G. (2021). Bosniak classification of cystic renal masses, version 2019: A pictorial guide to clinical use. RadioGraphics, 41(3), 814–828. https://doi.org/10.1148/rg.2021200160
- Pedrosa, I., Sun, M. R., Spencer, M., Genega, E. M., Olumi, A. F., DeWolf, W. C., & Rofsky, N. M. (2008). MR imaging of renal masses: Correlation with findings at surgery and pathologic analysis. RadioGraphics, 28(4), 985–1003. https://doi.org/10.1148/rg.284065018
- Chandarana, H., & Rosenkrantz, A. B. (2015). Renal function in a MR world: Current techniques and applications. Journal of Magnetic Resonance Imaging, 42(4), 858–870. https://doi.org/10.1002/jmri.24870
- Rosenkrantz, A. B., Hindman, N., Fitzgerald, E. F., Niver, B. E., Melamed, J., & Babb, J. S. (2010). MRI features of renal oncocytoma and chromophobe renal cell carcinoma. American Journal of Roentgenology, 195(6), W421–W427. https://doi.org/10.2214/AJR.10.4718
- Kang, S. K., Kim, D., & Chandarana, H. (2011). Contemporary imaging of the renal mass. Current Urology Reports, 12(1), 11–17. https://doi.org/10.1007/s11934-010-0148-0
- Israel, G. M., & Bosniak, M. A. (2005). How I do it: Evaluating renal masses. Radiology, 236(2), 441–450. https://doi.org/10.1148/radiol.2362040218
- Karlo, C. A., Donati, O. F., Burger, I. A., Zheng, J., Moskowitz, C. S., Hricak, H., & Akin, O. (2013). MR imaging of renal cortical tumours: Qualitative and quantitative chemical shift imaging parameters. European Radiology, 23(6), 1738–1744. https://doi.org/10.1007/s00330-012-2758-8
- Cornelis, F., Tricaud, E., Lasserre, A. S., Petitpierre, F., Bernhard, J. C., Le Bras, Y., Yacoub, M., Bouzgarrou, M., Ravaud, A., & Grenier, N. (2014). Routinely performed multiparametric magnetic resonance imaging helps to differentiate common subtypes of renal tumours. European Radiology, 24(5), 1068–1080. https://doi.org/10.1007/s00330-014-3107-x
- Northcutt, B. G., Shah, A., Sheoran, S., & Sahni, V. A. (2022). MR imaging of cystic renal masses. Magnetic Resonance Imaging Clinics of North America, 30(4), 641–655. https://doi.org/10.1016/j.mric.2022.06.001
- European Society of Urogenital Radiology. (2018). ESUR guidelines on contrast agents (Version 10.0). ESUR. esur.org/esur-guidelines-on-contrast-agents
- Levin, A., & Stevens, P. E. (2024). Executive summary of the KDIGO 2024 clinical practice guideline for the evaluation and management of chronic kidney disease. Kidney International, 105(4), 684–701. https://doi.org/10.1016/j.kint.2023.10.016
- McDonald, J. S., McDonald, R. J., Williamson, E. E., & Kallmes, D. F. (2023). Risk of acute kidney injury following IV iodinated contrast media exposure: 2023 update. American Journal of Roentgenology, 220(6), 800–807. https://doi.org/10.2214/AJR.23.30037
- Chen, S. Y., Li, Q., & Qin, X. (2022). Contrast-associated acute kidney injury: Advances and challenges. International Journal of General Medicine, 15, 1537–1546. https://doi.org/10.2147/IJGM.S341072
- Woo, S., Suh, C. H., Kim, S. Y., Cho, J. Y., & Kim, S. H. (2017). Diagnostic performance of MRI for differentiating renal angiomyolipoma without visible fat from other renal tumours: A systematic review and meta-analysis. European Radiology, 27(5), 1897–1905. https://doi.org/10.1007/s00330-016-4550-9
- Yu, X., Lin, M., Ouyang, H., Zhou, C., & Zhang, H. (2015). Application of ADC measurement in characterization of renal cell carcinomas with different pathological types and grades by 3.0T diffusion-weighted MRI. European Journal of Radiology, 84(6), 1027–1032. https://doi.org/10.1016/j.ejrad.2015.02.011
- Zhang, J., Tehrani, Y. M., & Wang, L. (2016). Renal masses: Characterization with diffusion-weighted MRI — a meta-analysis. Journal of Magnetic Resonance Imaging, 43(6), 1421–1430. https://doi.org/10.1002/jmri.25100
- Sun, M. R., Ngo, L., Genega, E. M., Atkins, M. B., Finn, M. E., Rofsky, N. M., & Pedrosa, I. (2009). Renal cell carcinoma: Dynamic contrast-enhanced MR imaging for differentiation of tumor subtypes — correlation with pathologic findings. Radiology, 250(3), 793–802. https://doi.org/10.1148/radiol.2503080995
- Choudhary, S., Rajesh, A., Mayer, N. J., Mulcahy, K. A., & Haroon, A. (2009). Renal oncocytoma: CT features cannot reliably distinguish oncocytoma from other renal neoplasms. Clinical Radiology, 64(5), 517–522. https://doi.org/10.1016/j.crad.2008.12.011
- Prasad, S. R., Humphrey, P. A., Catena, J. R., Narra, V. R., Srigley, J. R., Cortez, A. D., Dalrymple, N. C., & Chintapalli, K. N. (2006). Common and uncommon histologic subtypes of renal cell carcinoma: Imaging spectrum with pathologic correlation. RadioGraphics, 26(6), 1795–1806. https://doi.org/10.1148/rg.266065010
- Nikken, J. J., & Krestin, G. P. (2007). MRI of the kidney — state of the art. European Radiology, 17(11), 2780–2793. https://doi.org/10.1007/s00330-007-0701-1
- Krishna, S., Murray, C. A., McInnes, M. D., Chatelain, R., Siddaiah, M., Al-Dandan, O., Narayanasamy, S., Schieda, N. (2017). CT imaging of solid renal masses: Pitfalls and solutions. Clinical Radiology, 72(9), 708–721. https://doi.org/10.1016/j.crad.2017.05.003
- Zhu, Q., Xu, X., Zhang, C., Yang, Y., Chai, X., Guan, W., & Zhou, X. (2020). Diagnostic performance of the Bosniak classification, version 2019 vs. 2005, for the diagnosis of cystic renal masses: A systematic review and meta-analysis. European Radiology, 30(11), 6194–6207. https://doi.org/10.1007/s00330-020-06968-6
- International Commission on Radiological Protection. (2020). ICRP publication 147: Use of dosimetric quantities for regulatory purposes. ICRP. icrp.org/publication.asp?id=ICRP Publication 147
- SATMED Health. (2026, May 31). 7 proven strategies for optimizing MRI sequences in 2026. https://www.satmed-health.com/optimizing-mri-sequences/
- SATMED Health. (2026, March 1). 2026 contrast media guidelines: eGFR thresholds & safe administration protocol. https://www.satmed-health.com/2026-worldwide-guidelines…
- Corwin, M. T., Lee, J. S., Fananapazir, G., Wilson, M., & Lamba, R. (2018). Incremental value of qualitative enhancement categorisation in the diagnosis of T1a renal cell carcinoma. Clinical Radiology, 73(6), 599.e15–599.e20. https://doi.org/10.1016/j.crad.2018.01.017
- Fedeli, U., Grande, E., Grippo, F., & Frova, L. (2020). Trends in mortality from kidney cancer according to renal replacement therapy. European Journal of Public Health, 30(4), 692–694. https://doi.org/10.1093/eurpub/ckaa044
- Wang, Z. J., Nikolaidis, P., Khatri, G., Dogra, V., Ganeshan, D., Goldfarb, S., Gore, J. L., Gupta, R. T., Hartman, R., Heilbrun, M. E., Ivanovic, M., Kang, S. K., Nadolski, G., Purysko, A. S., Remer, E. M., Smith, A. D., & Silverman, S. G. (2022). ACR Appropriateness Criteria: Indeterminate renal mass. Journal of the American College of Radiology, 19(11), S369–S382. https://doi.org/10.1016/j.jacr.2022.09.009
Medically Reviewed by Prof. Dr. Damien O’Neil, MD, PhD
Last updated: July 8, 2026 | Reviewed for clinical accuracy and adherence to the latest guidelines of the European Society of Radiology (ESR), American College of Radiology (ACR), Radiological Society of North America (RSNA), European Society of Urogenital Radiology (ESUR), and the International Commission on Radiological Protection (ICRP).
(Organisations adjusted to those relevant to genitourinary/renal mass protocols.)
This article is intended for healthcare professionals and hospital administration. It does not constitute individual clinical advice. Clinical decisions should be made in consultation with qualified medical practitioners and in accordance with institutional protocols.