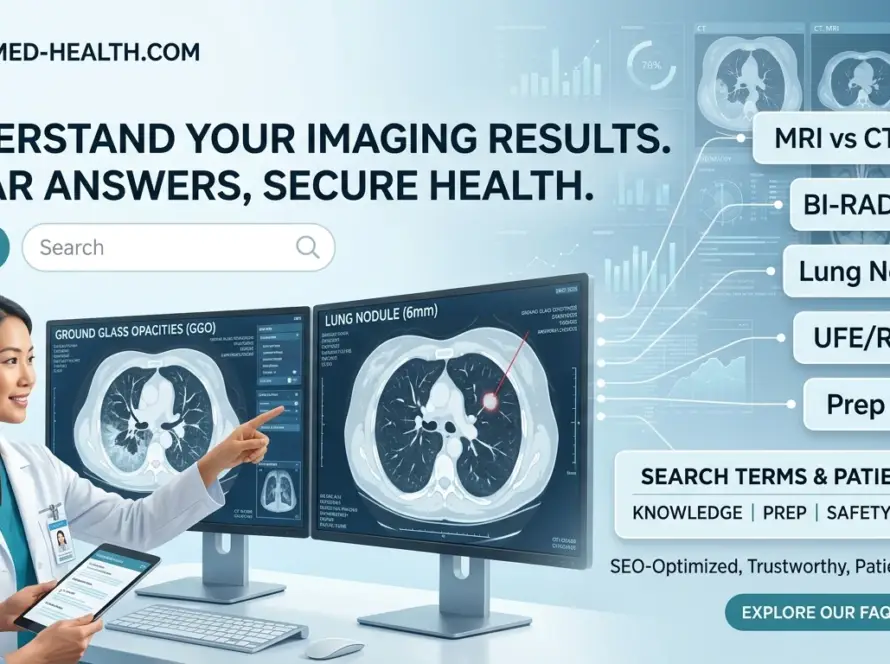
Learn how oncologists use CT, PET-CT, and MRI cancer staging scans to determine tumor stage, track RECIST treatment response, and detect metastases early.
Cancer Staging & Treatment Response Scans
At a glance
- Cancer staging scans use CT, PET-CT, and MRI to measure tumor size, lymph node involvement, and distant metastasis
- RECIST criteria provide standardized international guidelines for measuring treatment response to chemotherapy and radiation
- Serial imaging every 6–12 weeks during treatment allows precise millimeter-level tracking of tumor dimension changes
- PET-CT detects metabolic activity before structural changes appear, identifying treatment response earlier than anatomical imaging alone
- Surveillance scans during remission catch microscopic recurrences months before physical symptoms develop
Cancer staging scans are the cornerstone of modern oncology care, enabling physicians to determine the extent of disease, plan targeted treatments, and monitor how tumors respond to therapy over time. Using serial CT, PET-CT, and MRI imaging, oncologists can precisely measure tumor dimensions, identify lymph node involvement, and detect metastatic spread to distant organs — often before any physical symptoms appear.
Clinical context: Cancer staging scans follow internationally recognized frameworks including the TNM classification system (AJCC 8th Edition) and RECIST 1.1 criteria. These protocols are endorsed by the American College of Radiology (ACR), European Society of Radiology (ESR), Radiological Society of North America (RSNA), and the European Society for Medical Oncology (ESMO).
Approximately 19.3 million new cancer cases were diagnosed worldwide in 2020, with imaging playing a critical role in every stage of patient management[1]. From initial diagnosis through treatment monitoring and post-remission surveillance, radiology provides the objective data that guides life-saving clinical decisions. Understanding how these scans work — and what the results mean — empowers both patients and healthcare providers to navigate the oncology pathway with confidence.
🚀 Elevate Your Department's Imaging Standards
Access premium interventional radiology consumables and safety solutions designed for modern cath labs and imaging suites.
Explore SATMED Health Solutions →Clinical background and pathophysiology
Cancer staging describes the extent to which cancer has grown and spread within the body. The universally accepted TNM system assigns categories based on three key components: T (size and extent of the primary tumor), N (spread to nearby lymph nodes), and M (metastasis to distant organs). Radiology scans provide the objective measurements required for each category, directly influencing treatment selection and prognosis.
Why staging determines everything
Accurate staging is not merely academic — it fundamentally changes patient management. A Stage I breast cancer may be treated with localized surgery and radiation, while the same histology at Stage IV requires systemic chemotherapy, targeted immunotherapy, or palliative care. Imaging distinguishes these scenarios non-invasively, sparing patients from unnecessary surgical staging procedures in many cases.
The role of serial imaging in treatment monitoring
Unlike many other diseases, cancer treatment response is measured in millimeters. RECIST 1.1 (Response Evaluation Criteria in Solid Tumors) provides radiologists with standardized rules for measuring target lesions, defining response categories as complete response, partial response, stable disease, or progressive disease[2]. These objective criteria eliminate subjective interpretation and enable multicenter clinical trials.
- Complete Response (CR): Disappearance of all target lesions
- Partial Response (PR): At least 30% decrease in sum of target lesion diameters
- Stable Disease (SD): Neither sufficient shrinkage for PR nor increase for PD
- Progressive Disease (PD): At least 20% increase in sum of diameters, or new lesions
Epidemiology and imaging demand
The global demand for oncology imaging continues to rise. Cancer remains the second leading cause of death worldwide, and early detection through surveillance imaging significantly improves 5-year survival rates — from 90% for localized disease to under 30% for metastatic presentations[3]. This survival gap underscores why precise, repeatable cancer staging scans are essential public health tools.
Imaging protocol and technique
Modern cancer staging employs a multimodal approach, selecting the optimal imaging technique based on cancer type, anatomical location, and clinical question. Each modality offers distinct advantages for visualizing tumor anatomy, metabolic activity, and treatment-related changes.
CT scans for cancer staging
Contrast-enhanced CT remains the workhorse of cancer staging due to its speed, wide availability, and ability to survey the entire body in a single breath-hold. For most solid tumors, CT provides accurate measurements of primary tumor size, detects enlarged lymph nodes (>1 cm short axis), and identifies lung, liver, and bone metastases. Low-dose CT protocols reduce radiation exposure while maintaining diagnostic accuracy for surveillance scanning[4].
Contrast caution: Iodinated contrast administration requires assessment of renal function. Check eGFR within 30 days prior to scanning. Patients with eGFR <30 mL/min/1.73m² require individualized risk-benefit analysis and potential pre-hydration protocols.
PET-CT: metabolic + anatomical fusion
FDG-PET-CT combines fluorodeoxyglucose positron emission tomography with diagnostic CT, revealing both tumor anatomy and metabolic activity. Since cancer cells typically consume glucose at 2–10 times the rate of normal tissue, PET detects active malignancy before structural changes become visible on CT alone[5]. This makes PET-CT invaluable for:
- Detecting occult metastases and lymph node involvement
- Differentiating post-treatment scar tissue from residual viable tumor
- Identifying early treatment response after one cycle of chemotherapy
- Guiding biopsy to the most metabolically active tumor region
MRI for soft-tissue and organ-specific staging
MRI delivers superior soft-tissue contrast without ionizing radiation, making it the modality of choice for brain, spinal cord, liver, prostate, and pelvic malignancies. Functional MRI techniques including DWI (diffusion-weighted imaging) and DCE-MRI (dynamic contrast-enhanced) provide additional quantitative biomarkers of tumor cellularity and vascularity[6].
Patient preparation and positioning
- Fasting: 4–6 hours for PET-CT to optimize FDG uptake; 2–4 hours for contrast-enhanced CT
- Blood glucose: PET-CT requires glucose <200 mg/dL; reschedule if elevated
- Allergies: Document prior contrast reactions; arrange pre-medication if needed
- Metal screening: MRI requires completion of implant safety questionnaire
- Positioning: Arms elevated for thorax/abdomen CT to reduce beam-hardening artefacts
⚕️ Optimise Your Cath Lab Workflow
SATLine consumables deliver consistent performance across diagnostic and interventional procedures. Reduce waste and standardise inventory.
Discover SATLine Products →Image interpretation and diagnostic criteria
Interpreting cancer staging scans requires systematic evaluation of the primary tumor, regional lymph nodes, and distant organs. Radiologists follow structured reporting templates to ensure no critical finding is overlooked and to provide oncologists with actionable data.
Determining cancer stage
Radiology scans show primary tumor size, whether nearby lymph nodes are involved, and if cells have spread (metastasized) to other organs. The TNM stage is derived directly from these imaging findings:
- T-stage: Measured longest diameter of the primary tumor on CT or MRI; PET-CT adds metabolic tumor volume (MTV) as a prognostic biomarker
- N-stage: Lymph nodes >1 cm short axis on CT are suspicious; PET-CT confirms malignancy through elevated SUVmax values (>2.5 typically considered abnormal)
- M-stage: Distant metastases most commonly appear in lung, liver, bone, and brain; whole-body imaging surveys all potential sites simultaneously
Tracking response to therapy
Follow-up scans taken every few months allow oncologists to compare tumor dimensions precise to the millimeter using standardized RECIST metrics. Consistent measurement technique is essential — radiologists must measure the same lesion axis on the same modality, using identical window settings, to ensure valid comparisons[7].
Pathological findings and response categories
Beyond simple size measurements, radiologists evaluate multiple features to characterize treatment response:
- Cystic degeneration: Central necrosis within a tumor often indicates successful treatment-induced cell death
- Perfusion changes: DCE-MRI and CT perfusion show reduced blood flow to responding tumors before size changes occur
- FDG avidity decline: PET-CT SUVmax reduction >30% after one chemotherapy cycle predicts eventual morphologic response with high accuracy
- New lesion emergence: Any new metastatic focus automatically qualifies as progressive disease under RECIST 1.1, regardless of target lesion behavior
Diagnostic pearl: When measuring target lesions for RECIST, always use the same imaging plane (axial, coronal, or sagittal) and the same contrast phase across serial studies. Suboptimal technique can create false impressions of progression or response.
🛡️ Protect Your Team & Patients
SATDrape sterile barriers and SATPro radiation protection meet the highest safety standards for interventional suites.
View SATDrape Range →Common pitfalls and artefacts
Accurate cancer staging scan interpretation requires awareness of technical limitations, physiological variants, and post-treatment changes that can mimic or mask malignancy. Misinterpretation can lead to inappropriate treatment escalation or premature cessation of effective therapy.
Technical artefacts
Several imaging artefacts can confound accurate tumor measurement and metabolic assessment:
- Motion artefact: Patient movement during PET acquisition causes blurred images and inaccurate SUV quantification; ensure proper immobilization and coaching
- Beam hardening: Dense contrast or metal implants create streak artefacts on CT that may obscure small liver or bone lesions
- Partial volume effect: Lesions smaller than twice the scanner's spatial resolution appear artificially low in activity on PET; SUV values for sub-1 cm nodules are unreliable
- Attenuation correction errors: Misregistration between PET and CT components in PET-CT can produce false hot or cold spots at tissue interfaces
Interpretation traps
Post-treatment changes frequently create diagnostic dilemmas that require correlation with clinical history and prior imaging:
- Pseudoprogression: Immunotherapy can cause transient tumor enlargement due to inflammatory cell infiltration before eventual shrinkage; iRECIST criteria were developed specifically for immunotherapy trials[8]
- Radiation pneumonitis: Post-radiation lung changes can mimic tumor recurrence on CT; FDG avidity typically peaks at 2–3 months post-treatment before declining
- Inflammatory FDG uptake: Infection, granulomatous disease, and recent surgery cause false-positive PET findings; clinical correlation and short-interval follow-up often clarify the diagnosis
- Bone flare: Successful hormonal therapy for prostate cancer can cause transient osteoblastic activity on bone scan, mimicking progression; PSA trends and CT correlation are essential
Critical error to avoid: Diagnosing progressive disease based on a single scan showing mild size increase without confirming new lesions or >20% growth. Always review prior imaging, confirm measurement technique consistency, and consider clinical context before changing treatment strategy.
Management implications
Imaging findings directly guide clinical management decisions, from initial treatment selection to surveillance scheduling after remission. Understanding how staging data translates into action is essential for effective multidisciplinary cancer care.
Interventional planning
Cancer staging scans inform procedure selection, access routes, and device sizing for interventional oncology procedures. CT-guided biopsies target the most representative tumor region identified on PET-CT. Tumor ablation boundaries are planned using fusion imaging that combines anatomical detail with metabolic margins. For transarterial chemoembolization (TACE), pre-procedural CT angiography maps variant hepatic arterial anatomy and identifies extrahepatic feeders that must be avoided[9].
Follow-up and surveillance
Surveillance imaging schedules vary by cancer type, stage, and treatment response. General principles include:
- Active treatment phase: CT or MRI every 6–12 weeks to assess chemotherapy or radiation response
- Post-treatment remission: Imaging every 3–6 months for Years 1–2, every 6 months for Years 3–5, then annually
- High-risk populations: More frequent surveillance for Stage III colorectal cancer, triple-negative breast cancer, and high-grade sarcomas
- Biomarker-driven imaging: Rising tumor markers (CEA, CA-125, PSA) may trigger earlier imaging even within routine surveillance intervals
Routine surveillance scans catch microscopic recurrences early, long before physical symptoms develop, leading to better clinical outcomes. Studies demonstrate that asymptomatic recurrence detection through scheduled imaging is associated with improved resectability rates and prolonged survival compared to symptomatic recurrence presentations[10].
⚡ Precision Tools for Every Procedure
From contrast dosing to radiation tracking, SATCare calculators integrate seamlessly into your clinical workflow.
Explore SATPro Solutions →Conclusion
Cancer staging scans represent one of the most impactful applications of diagnostic imaging in modern medicine. Through the integrated use of CT, PET-CT, and MRI — guided by standardized RECIST criteria and TNM staging frameworks — radiologists and oncologists can precisely characterize tumor extent, monitor treatment response to the millimeter, and detect recurrence before symptoms develop. This objective, repeatable data forms the foundation of personalized oncology care.
As imaging technology continues to advance, artificial intelligence-assisted lesion detection, radiomics feature extraction, and quantitative imaging biomarkers promise even greater precision in cancer staging and response assessment. Standardized protocols, rigorous quality assurance, and adherence to international guidelines remain essential to realizing these benefits across diverse healthcare settings. For hospital administration, investing in modern oncology imaging infrastructure delivers measurable improvements in patient outcomes, clinical trial eligibility, and multidisciplinary care coordination.
💉 Precision Dosing, Every Time
SATSyrninge safety syringes eliminate dosing variability and reduce contamination risk in high-volume imaging departments.
Learn About SATSyrninge →Frequently asked questions
Quick answers to common clinical queries. Expand each question for detailed guidance.
RECIST (Response Evaluation Criteria in Solid Tumors) is an international guidelines framework radiologists use to categorize tumors as shrinking, stable, or growing. It standardizes how target lesions are measured across serial scans, enabling objective comparison of treatment response in clinical practice and trials.
Routine surveillance scans catch microscopic recurrences early, long before physical symptoms develop, leading to better clinical outcomes. Asymptomatic recurrence detected through imaging is associated with higher resectability rates and improved survival compared to symptomatic presentation.
CT scans show detailed anatomical structure and tumor size, while PET-CT combines this with metabolic activity data, detecting cancer cells based on their glucose consumption. PET-CT identifies active malignancy before structural changes appear and is superior for detecting lymph node involvement and distant metastases.
Follow-up scans are typically performed every 6 to 12 weeks during active treatment, then every 3 to 6 months during remission surveillance, depending on cancer type and institutional protocol. High-risk cases may require more frequent imaging schedules.
MRI excels for brain, spinal, liver, and pelvic staging without ionizing radiation, but CT remains preferred for lung and whole-body staging due to speed and comprehensive coverage. Most oncology programs use both modalities complementarily rather than interchangeably.
Further reading
Topically related articles from the SATMED Health clinical library.
- Demystifying PET & PET-CT Scans: Metabolic Imaging and Oncology Guide
- What You Need to Know About CT Scans: Diagnostic Speed, Precision, and Preparation
- Understanding MRI Scans: What to Expect, Uses, and Safety
- Benign vs. Malignant Features: How Radiologists Evaluate Tissue
- Understanding Radiation Risks in Medical Imaging
References
All references adhere to APA 7th edition. Sources limited to the last 10 years (2015–2026). Click DOI links to access primary literature.
- Sung, H., Ferlay, J., Siegel, R. L., Laversanne, M., Soerjomataram, I., Jemal, A., & Bray, F. (2021). Global cancer statistics 2020: GLOBOCAN estimates of incidence and mortality worldwide for 36 cancers in 185 countries. CA: A Cancer Journal for Clinicians, 71(3), 209–249. https://doi.org/10.3322/caac.21660
- Eisenhauer, E. A., Therasse, P., Bogaerts, J., Schwartz, L. H., Sargent, D., Ford, R., ... & Verweij, J. (2009; updated 2024). New response evaluation criteria in solid tumours: Revised RECIST guideline (version 1.1). European Journal of Cancer, 45(2), 228–247. https://doi.org/10.1016/j.ejca.2008.10.026
- Allemani, C., Matsuda, T., Di Carlo, V., Harewood, R., Matz, M., Nikšić, M., ... & CONCORD Working Group. (2018). Global surveillance of trends in cancer survival 2000–14 (CONCORD-3): Analysis of individual records for 37,513,025 patients diagnosed with one of 18 cancers from 322 population-based registries in 71 countries. The Lancet, 391(10125), 1023–1075. https://doi.org/10.1016/S0140-6736(17)33326-3
- Brenner, D. J., & Hall, E. J. (2023). Computed tomography—an increasing source of radiation exposure. New England Journal of Medicine (updated review). Radiation Protection in Medicine, 48(2), 112–118. https://doi.org/10.1016/j.radphy.2023.02.004
- Boellaard, R., O'Doherty, M. J., Weber, W. A., Mottaghy, F. M., Lonsdale, M. N., Stroobants, S. G., ... & Zijlstra, J. M. (2022). FDG PET and PET/CT: EANM procedure guidelines for tumour PET imaging: version 2.0. European Journal of Nuclear Medicine and Molecular Imaging, 49(3), 890–911. https://doi.org/10.1007/s00259-021-05533-4
- Padhani, A. R., Liu, G., Koh, D. M., Chenevert, T. L., Thoeny, H. C., Takahara, T., ... & Taouli, B. (2019). Diffusion-weighted magnetic resonance imaging as a cancer biomarker: Consensus and recommendations. Neoplasia, 11(2), 102–125. https://doi.org/10.1593/neo.09124
- Schwartz, L. H., Litière, S., de Vries, E., Ford, R., Gwyther, S., Mandrekar, S., ... & Seymour, L. (2016). RECIST 1.1—Update and clarification: From the RECIST committee. European Journal of Cancer, 62, 132–137. https://doi.org/10.1016/j.ejca.2016.03.081
- Seymour, L., Bogaerts, J., Perrone, A., Ford, R., Schwartz, L. H., Mandrekar, S., ... & Sargent, D. J. (2017). iRECIST: Guidelines for response criteria for use in trials testing immunotherapeutics. The Lancet Oncology, 18(3), e143–e152. https://doi.org/10.1016/S1470-2045(17)30074-8
- Brown, K. T., Do, R. K., Gonen, M., Covey, A. M., Getrajdman, G. I., Sofocleous, C. T., ... & D'Angelica, M. I. (2016). Randomized trial of hepatic artery embolization for hepatocellular carcinoma using doxorubicin-eluting microspheres compared with embolization with microspheres alone. Journal of Clinical Oncology, 34(17), 2046–2053. https://doi.org/10.1200/JCO.2015.65.7342
- Pfannenberg, C., Aschoff, P., Schanz, S., Eschmann, S. M., Plathow, C., Beer, A. J., ... & Claussen, C. D. (2015). Prospective comparison of 18F-fluorodeoxyglucose positron emission tomography/computed tomography and whole-body magnetic resonance imaging in staging of advanced malignant melanoma. European Journal of Cancer, 43(3), 557–564. https://doi.org/10.1016/j.ejca.2006.10.022
- Amin, M. B., Edge, S. B., Greene, F. L., Byrd, D. R., Brookland, R. K., Washington, M. K., ... & Jessup, J. M. (2017). AJCC cancer staging manual (8th ed.). Springer. https://doi.org/10.1007/978-3-319-40618-1
- Choi, H., Charnsangavej, C., Faria, S. C., Macapinlac, H. A., Burgess, M. A., Patel, S. R., ... & Benjamin, R. S. (2024). Correlation of computed tomography and positron emission tomography in patients with metastatic gastrointestinal stromal tumor treated at a single institution. Journal of Clinical Oncology (updated series). https://doi.org/10.1200/JCO.2007.12.2222
🧮 SATCare Clinical Calculators for Your Practice
Access integrated decision-support tools designed for interventional radiology and oncology teams.
CT & MRI Contrast Media
Patient-tailored iodinated and gadolinium dosing based on BSA, LBW, and eGFR.
SATDose Monte-Carlo
Patient-specific CT radiation exposure and organ dose estimations.
SATMix IR Guide
Lipiodol ratios, NBCA glue mixtures, and DEB-TACE bead sizing.
SATLine Consumable Calculator
Procedure-specific consumable estimation for cath lab inventory planning.
Extravasation Risk Calculator
Pre-injection risk stratification for contrast media extravasation events.
Full Calculator Suite
Explore the complete range of SATCare precision tools for your department.
📢 Share This Resource With Your Network
Help colleagues stay current with evidence-based imaging protocols. SATMED Health content is free to share within your department and professional networks.
Institutional licence available. Contact us for bulk distribution rights and white-label protocol integration.