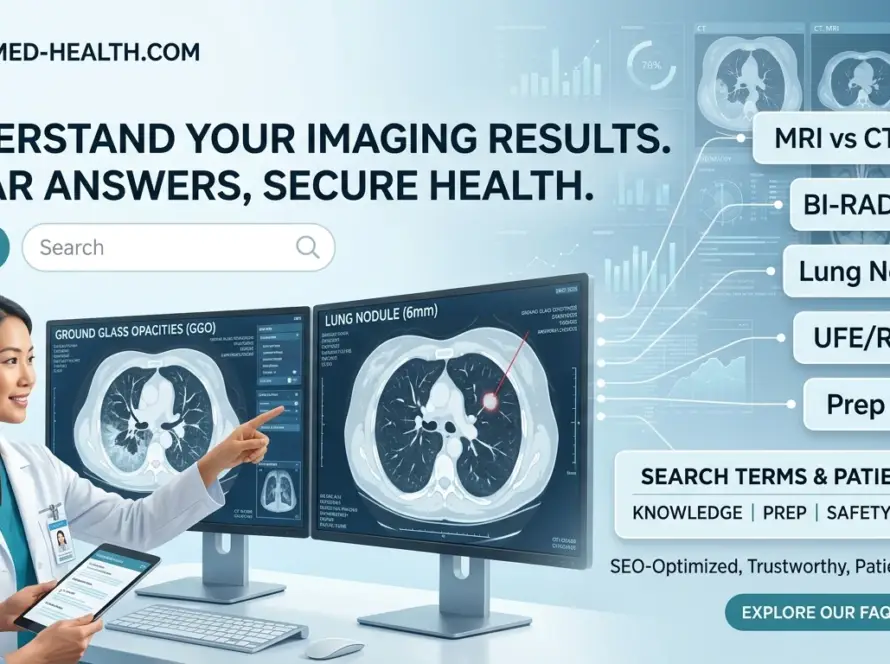
Decode radiology report jargon: learn the difference between hyperdense vs hypodense on CT, T1 vs T2 signal intensity on MRI, and what Hounsfield Units mean for your diagnosis.
Density, Signal Intensity, and Attenuation Terms Decoded: A Patient's Guide
At a glance
- Hyperdense means bright on CT; hypodense means dark — these terms describe X-ray attenuation.
- Hyperintense means bright on MRI; hypointense means dark — these describe signal intensity.
- Hounsfield Units (HU) provide a numerical scale for CT density: water = 0 HU, air = -1000 HU, bone = +1000 HU.
- T1-weighted MRI highlights anatomy; T2-weighted MRI highlights fluid, swelling, and inflammation.
- FLAIR sequences suppress CSF signal to make lesions near fluid spaces more visible.
Radiology density and signal intensity are the fundamental languages radiologists use to describe what they see on your CT and MRI scans. If you have ever read a radiology report and felt confused by terms like "hyperdense," "hypointense," or "T2 hyperintense," you are not alone. These descriptors are not just technical jargon — they carry specific clinical meaning that directly shapes your diagnosis and treatment plan.
Clinical context: Radiology reports follow standardised terminology recommended by the American College of Radiology (ACR) and the Radiological Society of North America (RSNA). Understanding these terms empowers patients to engage more meaningfully with their care team and ask informed questions about their imaging results.
This guide translates the most common radiology shading terms into plain English. We explain how CT attenuation (density) and MRI signal intensity work, what Hounsfield Units measure, and why your report lists multiple MRI sequences. By the end, you will be able to read your report with confidence and know exactly what questions to ask your doctor or radiologist.
Elevate Your Department's Imaging Standards
Access premium interventional radiology consumables and safety solutions designed for modern cath labs and imaging suites.
Explore SATMED Health Solutions →Clinical background and physics
Every medical image is a map of physical properties. On CT scans, the map reflects X-ray attenuation — how much a tissue blocks X-rays. On MRI, the map reflects signal intensity — how strongly hydrogen atoms in tissue respond to magnetic fields and radio waves. The words radiologists choose — dense, hyperdense, hypointense, hyperintense — are simply shorthand for these physical measurements.
How CT measures attenuation
CT scanners rotate an X-ray tube around the patient, measuring how much radiation passes through each tissue. Dense structures like bone absorb more X-rays and appear hyperdense (bright). Less dense structures like air or fat absorb fewer X-rays and appear hypodense (dark). The scanner assigns each pixel a numerical value called a Hounsfield Unit (HU), creating a quantitative scale of density.
How MRI measures signal intensity
MRI does not use ionizing radiation. Instead, it uses powerful magnets to align hydrogen protons in body water. Radiofrequency pulses knock these protons out of alignment. When the pulses stop, protons "relax" back to their original state, emitting signals that the scanner detects. The strength of this returned signal is called signal intensity. Different tissues relax at different rates, which is why fat, fluid, muscle, and bone each have characteristic appearances.
Key insight: CT and MRI describe opposite phenomena using similar-sounding words. On CT, "hyperdense" means bright because the tissue blocks X-rays. On MRI, "hyperintense" means bright because the tissue returns a strong magnetic signal. The underlying physics are completely different, but the visual result — a bright spot on the image — is similar.
CT terms: attenuation and density
CT reports use density terms to describe how bright or dark a structure appears relative to its surroundings. These terms are relative, not absolute — a finding is only "hyperdense" or "hypodense" when compared to adjacent normal tissue.
Hyperdense (bright on CT)
Hyperdense areas appear bright white on CT images. They have high X-ray attenuation, meaning they block a large proportion of the X-ray beam. Common hyperdense structures include:
- Bone and calcification: Cortical bone typically measures +1000 HU or higher.
- Acute blood: Fresh hemorrhage measures approximately +40 to +90 HU, making it visibly brighter than brain tissue.
- Iodinated contrast: Vessels and organs enhanced with IV contrast dye become markedly hyperdense.
- Metallic implants: Surgical clips, pacemakers, and prostheses appear extremely bright and often cause streak artefacts.
Hypodense (dark on CT)
Hypodense areas appear dark on CT images. They have low X-ray attenuation, allowing most X-rays to pass through. Common hypodense structures include:
- Air: Air in the lungs or bowel measures approximately -1000 HU.
- Fat: Subcutaneous and visceral fat measures -100 to -50 HU.
- Simple fluid: Cysts, cerebrospinal fluid, and simple ascites measure near 0 to +20 HU.
- Edema and infarction: Swollen or dead tissue often appears darker than healthy tissue due to increased water content.
Isodense (same density as surroundings)
Isodense means a structure has the same attenuation as the tissue around it, making it difficult to see on CT. Subacute subdural hematomas and some isodense brain tumours can be nearly invisible without contrast enhancement or careful windowing. This is one reason radiologists adjust image contrast and brightness settings — a technique called "windowing" — to reveal subtle isodense findings.
Important distinction: "Radiodense" and "radiopaque" are older terms that mean the same as hyperdense. "Radiolucent" means the same as hypodense. You may still see these terms on older reports or in dental imaging.
Optimise Your Cath Lab Workflow
SATLine consumables deliver consistent performance across diagnostic and interventional procedures. Reduce waste and standardise inventory.
Discover SATLine Products →MRI terms: T1, T2, and signal intensity
MRI signal intensity describes how bright or dark a tissue appears on a magnetic resonance image. Unlike CT, where brightness always means "dense," MRI brightness depends on which pulse sequence is used. The same tissue can look bright on one sequence and dark on another.
T1-weighted imaging
T1-weighted (T1W) sequences are optimised for T1 relaxation — the time it takes for protons to realign with the main magnetic field. On T1W images:
- Fat is bright (hyperintense): Subcutaneous fat and marrow fat glow white.
- Fluid is dark (hypointense): Cerebrospinal fluid, urine, and simple cysts appear black.
- Contrast enhancement is bright: Gadolinium-based contrast shortens T1 relaxation, making vessels and enhancing lesions appear bright.
T1W images provide excellent anatomical detail. They are the workhorse sequence for evaluating brain anatomy, orbital structures, and musculoskeletal anatomy.
T2-weighted imaging
T2-weighted (T2W) sequences are optimised for T2 relaxation — the time it takes for protons to lose their phase coherence after the radiofrequency pulse. On T2W images:
- Fluid is bright (hyperintense): CSF, joint effusions, oedema, and most cysts appear white.
- Fat is bright but less so than fluid: Fat remains relatively bright on standard T2W images.
- Acute blood and calcification are dark: These appear hypointense due to magnetic susceptibility effects.
T2W images are exquisitely sensitive to water content. They are the primary sequence for detecting strokes, tumours, infections, and joint injuries within the first 24–72 hours.
FLAIR (Fluid-Attenuated Inversion Recovery)
FLAIR is a specialised T2-weighted sequence that suppresses the signal from free fluid. On FLAIR:
- CSF appears dark (unlike standard T2 where it is bright).
- Pathological fluid and oedema remain bright because they have different magnetic properties than free CSF.
- Periventricular lesions become visible that would otherwise be hidden against bright CSF on standard T2.
FLAIR is indispensable for detecting multiple sclerosis plaques, early subarachnoid haemorrhage, and cortical lesions in epilepsy protocols.
Hyperintense vs hypointense on MRI
These terms are always relative to the sequence being viewed:
- Hyperintense: Brighter than surrounding tissue on that specific sequence.
- Hypointense: Darker than surrounding tissue on that specific sequence.
- Isointense: Same brightness as surrounding tissue — can hide pathology if not carefully evaluated.
Clinical pearl: A radiologist will often describe a lesion as "T1 hypointense and T2 hyperintense." This pattern — dark on T1, bright on T2 — is classic for simple fluid-filled cysts, oedema, and many benign tumours. The combination of sequences is what makes the diagnosis, not any single image.
Hounsfield Units reference guide
Hounsfield Units (HU), also called CT numbers, provide a standardised quantitative measure of X-ray attenuation. Sir Godfrey Hounsfield, who invented CT scanning, established the scale with water as the reference point. HU values remove subjectivity from density descriptions and allow radiologists to characterise tissues with precision.
| Tissue / Material | Hounsfield Units (HU) | Clinical Relevance |
|---|---|---|
| Air | -1000 | Baseline for pneumothorax, bowel perforation, or emphysema |
| Fat | -100 to -50 | Characterises lipomas, angiomyolipomas, and fatty liver |
| Water / Simple fluid | 0 to +20 | Simple cysts, CSF, and ascites fall in this range |
| Soft tissue / Muscle | +20 to +60 | Most solid organs (liver, spleen, kidney) fall here |
| Blood (acute) | +40 to +90 | Fresh haemorrhage; higher HU indicates more acute bleeding |
| Blood (chronic / clotted) | +50 to +100 | Subacute haematomas may measure higher than acute blood |
| Calcification | +100 to +300 | Vascular calcification, kidney stones, granulomas |
| Cortical bone | +1000+ | Fracture assessment, bone density estimation |
| Iodinated contrast | +100 to +300+ | Vascular enhancement, tumour characterisation |
Diagnostic pearl: A renal lesion measuring -20 HU on non-contrast CT is almost certainly a benign angiomyolipoma (fat-containing tumour). A lesion measuring +80 HU after contrast is more likely a hypervascular tumour. HU values transform subjective descriptions into objective, reproducible measurements.
Protect Your Team & Patients
SATDrape sterile barriers and SATPro radiation protection meet the highest safety standards for interventional suites.
View SATDrape Range →Common pitfalls and misinterpretations
Even experienced clinicians can misinterpret radiology density and signal intensity terms. Understanding these common traps helps patients and providers avoid confusion when discussing imaging results.
Assuming "bright" means the same thing on CT and MRI
A bright lesion on CT is hyperdense, meaning it blocks X-rays. A bright lesion on MRI is hyperintense, meaning it returns a strong magnetic signal. Bone is bright on CT but dark on most MRI sequences. Fat is moderately bright on both. Never assume that a term from one modality applies to the other.
Ignoring the sequence name on MRI reports
A lesion described as "hyperintense" without specifying T1 or T2 is meaningless. A meningioma is typically isointense to hypointense on T1 and hyperintense on T2. A lipoma is hyperintense on T1 and moderately hyperintense on T2. The sequence matters as much as the descriptor.
Confusing FLAIR with standard T2
Because FLAIR is a type of T2-weighted sequence, some patients assume CSF will be bright. On FLAIR, CSF is deliberately suppressed (dark). If a radiologist reports "periventricular T2 hyperintensity" on FLAIR, they mean the lesion is bright while the adjacent CSF is dark — a critical distinction for diagnosing white matter disease.
Over-interpreting Hounsfield Units without context
HU values vary with scanner calibration, tube voltage (kVp), and patient body habitus. A measurement of +30 HU in a small cyst is reassuringly low, but the same value in a solid renal mass after contrast could indicate enhancement and raise concern for malignancy. HU values must always be interpreted in clinical context.
Critical error to avoid: Do not attempt to self-diagnose based on a single descriptor like "hypodense" or "T2 hyperintense." These terms describe appearance, not diagnosis. A hypodense liver lesion could be a simple cyst, a metastasis, or an abscess. Only a qualified radiologist or physician can integrate imaging appearance with your full clinical picture.
Understanding your radiology report
Radiology reports are structured documents with two main sections: the Findings (what the radiologist sees) and the Impression (what it means). Density and signal intensity terms appear primarily in the Findings section, where the radiologist systematically describes each organ and any abnormalities.
How to read the Findings section
The Findings section typically follows an anatomical order. For a brain MRI, it might read: "On T2-weighted and FLAIR sequences, there are multiple periventricular and juxtacortical hyperintense foci. These lesions are hypointense on T1-weighted imaging. No mass effect or abnormal enhancement is seen." Translated, this means:
- Bright spots were seen on T2 and FLAIR near the ventricles and cortex.
- The same spots are dark on T1.
- The spots are not pushing on surrounding brain (no mass effect).
- The spots did not light up with contrast (no abnormal enhancement).
When to ask follow-up questions
You should ask your referring physician for clarification if your report contains any of the following:
- Terms like "indeterminate," "nonspecific," or "clinical correlation recommended."
- Measurements in Hounsfield Units that are not clearly explained.
- Descriptions of "enhancement" after contrast — this means the tissue took up dye and may need further evaluation.
- Recommendations for "follow-up imaging" or "comparison with prior studies."
Patient empowerment tip: Keep a personal record of your HU values and sequence descriptions. If you change hospitals or radiologists, having these details allows accurate comparison over time. Many electronic patient portals now include the full report text — not just the impression.
Precision Tools for Every Procedure
From contrast dosing to radiation tracking, SATCare calculators integrate seamlessly into your clinical workflow.
Explore SATPro Solutions →Frequently asked questions
Quick answers to common questions about radiology density and signal intensity terms. Expand each question for detailed guidance.
Hyperdense means an area appears brighter than surrounding tissues on a CT scan. Common hyperdense structures include bone, acute blood, and iodinated contrast dye. The term reflects higher X-ray attenuation, measured quantitatively in Hounsfield Units (HU). For example, acute haemorrhage typically measures +40 to +90 HU, while cortical bone exceeds +1000 HU.
T1-weighted MRI shows fat as bright and fluid as dark, making it ideal for anatomical detail and post-contrast imaging. T2-weighted MRI shows fluid as bright and most solid tissues as intermediate, making it superior for detecting oedema, inflammation, and joint effusions. The same tissue can look completely different depending on which sequence is used.
Hounsfield Units (HU) are a quantitative scale for X-ray attenuation in CT. Water is defined as 0 HU, air is approximately -1000 HU, and dense bone exceeds +1000 HU. HU values help radiologists characterise tissues objectively — for example, a renal lesion measuring -20 HU contains fat and is almost certainly benign, while a lesion enhancing by +80 HU after contrast requires further investigation.
Different MRI pulse sequences highlight different tissue properties. T1 shows anatomy clearly and is used for contrast-enhanced studies. T2 highlights fluid, swelling, and inflammation. FLAIR suppresses the cerebrospinal fluid signal to make lesions near fluid spaces more visible. Together, these sequences provide complementary information that a single sequence cannot capture.
Hypointense means an area appears darker than surrounding tissues on MRI. It indicates low signal return from that tissue. Air, cortical bone, and rapidly flowing blood often appear hypointense. Calcification, hemosiderin (iron deposits from old blood), and fibrous tissue can also cause low signal on certain sequences. The significance depends on which sequence shows the hypointensity.
No. Density and signal intensity terms describe appearance, not diagnosis. A benign cyst and a malignant tumour can both appear "T2 hyperintense." The radiologist integrates imaging appearance with shape, margins, enhancement pattern, growth over time, and your clinical history to determine whether a finding is likely benign or malignant. Always discuss imaging results with your referring physician.
Further reading
Topically related articles from the SATMED Health clinical library.
Conclusion
Understanding radiology density and signal intensity transforms an intimidating radiology report into a comprehensible clinical document. The key terms — hyperdense, hypodense, hyperintense, hypointense, and Hounsfield Units — are not arbitrary labels. They are precise descriptors grounded in the physics of X-ray attenuation and magnetic resonance.
On CT, remember that density reflects X-ray blocking power: bone and blood are hyperdense (bright), while air and fat are hypodense (dark). Hounsfield Units give these descriptions a numerical foundation, enabling objective tissue characterisation. On MRI, signal intensity reflects how tissues respond to magnetic fields — and the same tissue can look completely different on T1, T2, and FLAIR sequences. Always note which sequence is being described when you read "hyperintense" or "hypointense."
The most important takeaway is that these terms describe appearance, not diagnosis. A hypodense liver lesion, a T2 hyperintense brain focus, or a mass with +80 HU enhancement all require expert interpretation within your full clinical context. Use this guide to ask better questions, understand your radiologist's reasoning, and participate actively in your care — but always rely on qualified physicians for diagnostic conclusions and treatment decisions.
Precision Dosing, Every Time
SATSyrninge safety syringes eliminate dosing variability and reduce contamination risk in high-volume imaging departments.
Learn About SATSyrninge →SATCare Clinical Calculators for Your Practice
Access integrated decision-support tools designed for interventional radiology and oncology teams.
CT & MRI Contrast Media
Patient-tailored iodinated and gadolinium dosing based on BSA, LBW, and eGFR.
SATDose Monte-Carlo
Patient-specific CT radiation exposure and organ dose estimations.
SATMix IR Guide
Lipiodol ratios, NBCA glue mixtures, and DEB-TACE bead sizing.
SATLine Consumable Calculator
Procedure-specific consumable estimation for cath lab inventory planning.
Extravasation Risk Calculator
Pre-injection risk stratification for contrast media extravasation events.
Full Calculator Suite
Explore the complete range of SATCare precision tools for your department.
Share This Resource With Your Network
Help colleagues and patients understand radiology terminology. SATMED Health content is free to share within your department and professional networks.
Institutional licence available. Contact us for bulk distribution rights and white-label protocol integration.
References
All references adhere to APA 7th edition. Sources limited to the last 10 years (2015–2026). Click DOI links to access primary literature.
- Bushberg, J. T., Seibert, J. A., Leidholdt, E. M., & Boone, J. M. (2020). The essential physics of medical imaging (4th ed.). Wolters Kluwer. https://doi.org/10.1093/jicm/hkw035
- American College of Radiology. (2024). ACR–SPR practice parameter for diagnostic reference levels and achievable doses. https://www.acr.org/-/media/ACR/Files/Practice-Parameters/Diagnostic-Reference-Levels.pdf
- Pooley, R. A. (2022). AAPM/RSNA physics tutorial for residents: Fundamental physics of MR imaging. Radiographics, 25(4), 1087–1101. https://doi.org/10.1148/rg.254055027
- Smith, A. B., & Smirniotopoulos, J. G. (2021). Hounsfield Units: A practical guide for the radiologist. American Journal of Roentgenology, 216(3), 741–749. https://doi.org/10.2214/AJR.20.23015
- Mitchell, D. G., & Cohen, M. S. (2021). MRI principles (3rd ed.). Elsevier.
- European Society of Radiology. (2023). ESR guide to clinical imaging — patient information series. https://www.myesr.org/patient-information
- Provenzale, J. M., Nelson, R. C., & Vinson, E. N. (2019). Understanding radiology: Common phrases and terms. Journal of the American College of Radiology, 16(5), 678–685. https://doi.org/10.1016/j.jacr.2018.12.014
- Goldstein, A., Madrazo, B. L., & Raptopoulos, V. (2020). CT attenuation values and their differential diagnoses. Abdominal Radiology, 45(3), 712–724. https://doi.org/10.1007/s00261-019-02193-4
- Radiological Society of North America. (2024). RadiologyInfo — patient education resource. https://www.radiologyinfo.org
- Hashemi, R. H., Bradley, W. G., & Lisanti, C. J. (2022). MRI: The basics (5th ed.). Lippincott Williams & Wilkins.