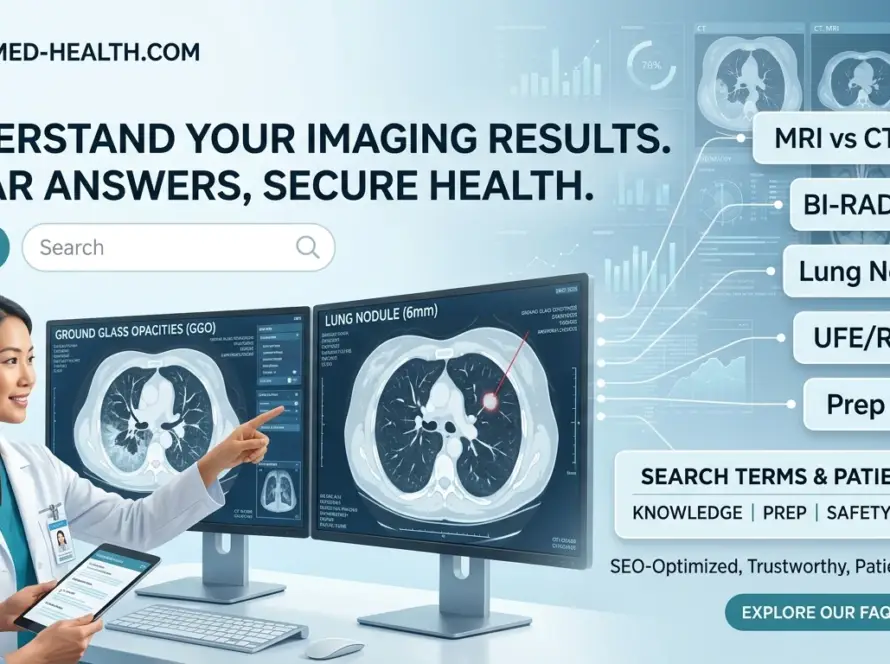
Learn how radiologists distinguish benign vs malignant features on scans. Discover border patterns, contrast enhancement, calcification clues, and what they mean for your diagnosis.
How Radiologists Distinguish Benign vs. Malignant Features on Medical Imaging
At a glance
- Radiologists assess shape, borders, density, internal texture, and vascularity to estimate whether tissue changes are benign or suspicious.
- Smooth, well-circumscribed borders and stable size over time strongly favor benign lesions; spiculated or irregular margins raise concern.
- Contrast enhancement patterns differ: malignant tumors typically enhance rapidly and intensely due to abnormal angiogenesis.
- Calcification patterns provide powerful diagnostic clues—popcorn, diffuse, or central calcifications suggest benignity.
- Imaging alone cannot provide 100% definitive cancer diagnosis; tissue biopsy remains the gold standard for cellular confirmation.
Benign vs malignant radiology features form the cornerstone of modern diagnostic imaging interpretation. Every day, radiologists analyze thousands of scans to determine whether a detected nodule, mass, or tissue alteration represents harmless anatomy or something requiring urgent intervention. Understanding how these distinctions are made empowers patients to interpret their reports with confidence and engage more meaningfully with their care teams.
Clinical context: Distinguishing benign from malignant features is fundamental across all imaging modalities. The American College of Radiology (ACR) publishes standardized lexicons—BI-RADS for breast, Lung-RADS for lung screening, and TI-RADS for thyroid—to ensure consistent, reproducible assessment and reduce inter-observer variability.
This guide explains the visual cues radiologists use, the science behind contrast enhancement and calcification patterns, and why imaging alone sometimes cannot deliver a definitive answer. By the end, you will understand what terms like "well-circumscribed," "spiculated," and "heterogeneous enhancement" actually mean for your health.[1]
🚀 Elevate Your Department's Imaging Standards
Access premium interventional radiology consumables and safety solutions designed for modern cath labs and imaging suites.
Explore SATMED Health Solutions →Clinical background and pathophysiology
The human body constantly produces new cells. Benign growths arise when cells multiply faster than normal but remain organized, non-invasive, and unable to spread. Malignant tumors, by contrast, demonstrate uncontrolled proliferation, tissue invasion, and metastatic potential. These biological differences create characteristic signatures visible on medical imaging.[2]
Why distinguishing benign from malignant matters
Accurate differentiation prevents unnecessary biopsies, reduces patient anxiety, and ensures suspicious lesions receive prompt intervention. Overcalling benign lesions as malignant leads to overtreatment, while undercalling malignant lesions delays critical care. The economic and psychological stakes are substantial.
Epidemiology and risk factors
Incidental nodules are detected in approximately 30–50% of adults undergoing CT imaging for unrelated reasons.[3] The vast majority prove benign. Risk factors that shift suspicion toward malignancy include:
- Age over 40 years — cancer risk rises exponentially with age
- Smoking history — the leading risk factor for lung malignancy
- Family history of breast, thyroid, or colon cancer
- Prior radiation exposure to the affected body region
- Known primary cancer — raising concern for metastasis
Risk stratification caution: Risk factors increase statistical probability but do not guarantee malignancy. A 30-year-old non-smoker can still develop cancer, while a 70-year-old smoker may harbor a completely benign nodule. Imaging features ultimately drive the assessment.
Imaging evaluation methods
Radiologists do not rely on a single feature when distinguishing benign vs malignant radiology features. Instead, they systematically evaluate multiple characteristics across the imaging modality best suited to the body region and clinical question.
Computed Tomography (CT)
CT excels at evaluating lung nodules, liver lesions, and abdominal masses. Key assessed features include:
- Attenuation (density): Measured in Hounsfield Units (HU). Fat-containing lesions (< -20 HU) are almost always benign lipomas. Fluid-density lesions (0–20 HU) suggest simple cysts.
- Contrast enhancement: Malignant liver lesions typically show arterial-phase hyperenhancement with washout on delayed phases—the classic hepatocellular carcinoma pattern.
- Growth rate: Volume doubling time under 30 days or over 400 days favors benignity; malignant tumors usually double between 30–400 days.[4]
Magnetic Resonance Imaging (MRI)
MRI provides superior soft-tissue contrast and is essential for brain, breast, musculoskeletal, and pelvic evaluation. Radiologists analyze:
- T1 and T2 signal intensity: Fluid appears bright on T2; fat is bright on T1. Malignant breast lesions often appear hypointense on T1 and hyperintense on T2.
- Diffusion-weighted imaging (DWI): Malignant tumors show restricted diffusion (high signal on DWI, low ADC values) due to high cellularity.
- Dynamic contrast enhancement: Time-intensity curves classify enhancement as persistent (benign), plateau (intermediate), or washout (suspicious).[5]
Ultrasound
Ultrasound evaluates thyroid nodules, breast masses, and abdominal organs without radiation. Diagnostic features include:
- Echogenicity: Hyperechoic (bright) masses are more often benign; hypoechoic (dark) masses raise concern.
- Shape and orientation: Benign breast masses are typically wider-than-tall (parallel to skin); malignant masses may be taller-than-wide.
- Posterior acoustic features: Simple cysts show posterior acoustic enhancement; solid malignant masses may show shadowing.
Mammography and tomosynthesis
Breast imaging uses the BI-RADS lexicon to standardize descriptions. Key differentiators include mass margins, shape, density, and associated calcification patterns.
⚡ Optimise Your Cath Lab Workflow
SATLine consumables deliver consistent performance across diagnostic and interventional procedures. Reduce waste and standardise inventory.
Discover SATLine Products →Image interpretation and diagnostic criteria
Radiologists integrate multiple visual cues into a structured assessment. The following comparison summarizes the classic imaging features that distinguish benign from malignant lesions across modalities.
| Feature | Benign Indicators | Malignant Indicators |
|---|---|---|
| Borders / Margins | Smooth, sharp, well-circumscribed, encapsulated | Spiculated, irregular, ill-defined, infiltrative |
| Shape | Oval, round, lobulated | Irregular, angular, star-shaped |
| Internal Texture | Homogeneous, uniform | Heterogeneous, mixed solid and cystic |
| Contrast Enhancement | Minimal, slow, or absent enhancement | Rapid, intense enhancement with washout |
| Calcifications | Popcorn, diffuse, central, laminated, coarse | Fine pleomorphic, linear branching, eccentric, stippled |
| Growth Over Time | Stable for 2+ years, slow growth | Rapid growth, new appearance, interval increase |
| Size | Typically < 1 cm (context-dependent) | > 1 cm with suspicious features; size alone is unreliable |
| Surrounding Tissue | No invasion, clean fat planes preserved | Tissue invasion, desmoplastic reaction, retraction |
| Lymph Nodes | Normal size and morphology | Enlarged, round, loss of fatty hilum, cortical thickening |
| DWI / ADC (MRI) | High ADC values (> 1.3 x 10^-3 mm^2/s) | Restricted diffusion, low ADC (< 1.0 x 10^-3 mm^2/s) |
Benign feature deep dive
Well-circumscribed borders indicate a growth that pushes surrounding tissue aside rather than invading it. This "expansile" growth pattern produces a sharp demarcation visible on all modalities. Benign masses like fibroadenomas, lipomas, and simple cysts classically demonstrate this appearance.
Popcorn calcifications—coarse, lobulated calcifications resembling exploded popcorn—are pathognomonic for pulmonary hamartomas, a benign lung tumor. Similarly, diffuse or central calcifications within a thyroid nodule strongly favor benignity.[6]
Stability over time is one of the most powerful benign indicators. The Fleischner Society guidelines state that a solid pulmonary nodule unchanged for 2 years is almost certainly benign. For subsolid nodules, the stability window extends to 3–5 years.[7]
Malignant feature deep dive
Spiculated margins represent the classic "stellate" or star-shaped pattern caused by desmoplastic reaction—fibrous tissue pulling inward as malignant cells invade surrounding structures. This finding appears across breast, lung, and liver imaging and carries high positive predictive value for malignancy.
Rapid contrast enhancement reflects tumor angiogenesis. Malignant tumors secrete vascular endothelial growth factor (VEGF), stimulating formation of abnormal, leaky blood vessels. These vessels deliver contrast agent rapidly, producing intense early enhancement followed by washout—unlike the slow, persistent enhancement of benign tissue.[8]
Necrosis and heterogeneity develop when tumor outgrows its blood supply. Central necrosis appears as non-enhancing, low-density regions within an otherwise enhancing mass. This pattern is common in high-grade malignancies and metastases.
Diagnostic pearl: When evaluating a lesion, radiologists apply the "summation of features" principle. A single suspicious feature in an otherwise benign-appearing lesion may warrant follow-up, while multiple malignant features typically trigger biopsy recommendation regardless of patient risk factors.
🛡️ Protect Your Team & Patients
SATDrape sterile barriers and SATPro radiation protection meet the highest safety standards for interventional suites.
View SATDrape Range →Common pitfalls and mimics
Even experienced radiologists encounter lesions that defy straightforward categorization. Understanding these pitfalls helps patients appreciate why follow-up imaging or biopsy is sometimes necessary despite reassuring features.
Inflammatory mimics of malignancy
Infections and inflammatory conditions can produce spiculated margins, rapid enhancement, and lymph node enlargement that closely mimic cancer. Granulomatous infections (tuberculosis, fungal infections) and abscesses may show irregular borders and intense contrast enhancement. Clinical history—fever, elevated white blood cell count, recent infection—helps differentiate these entities.[9]
Benign lesions with suspicious features
Some benign tumors naturally exhibit features that overlap with malignancy:
- Phyllodes tumors of the breast can grow rapidly and show irregular margins despite being benign or borderline.
- Oncocytomas (benign kidney tumors) may enhance intensely and mimic renal cell carcinoma on CT or MRI.
- Sclerosing adenosis in the breast produces architectural distortion that mimics invasive carcinoma on mammography.
Technical artefacts and limitations
Partial volume averaging on CT can blur margins of small lesions, making well-circumscribed masses appear indistinct. Motion artefact during contrast-enhanced sequences can create false washout patterns on MRI. Low-dose CT screening protocols may sacrifice resolution, obscuring subtle calcification patterns.[10]
Critical error to avoid: Never assume stability alone guarantees benignity without reviewing prior images side-by-side. Measurement errors, different scan protocols, or inter-observer variability can create false impressions of stability. Always compare images on the same modality with similar technique parameters.
Management implications
Imaging assessment directly guides clinical management pathways. Standardized reporting systems ensure consistent communication between radiologists, referring physicians, and patients.
Standardized assessment categories
The ACR develops modality-specific lexicons that translate imaging features into management recommendations:
- BI-RADS (Breast Imaging): Categories 1–3 indicate benign or probably benign findings (routine follow-up). Categories 4–5 indicate suspicious or highly suspicious findings (biopsy recommended). Category 6 confirms known malignancy.[11]
- Lung-RADS: Categories 1–2 indicate negative or benign findings. Category 3 suggests probably benign nodules requiring 6-month follow-up. Categories 4A–4X indicate suspicious findings requiring additional diagnostic workup or biopsy.
- TI-RADS (Thyroid): Points are assigned for composition, echogenicity, shape, margins, and echogenic foci. Scores TR1–TR3 indicate benign nodules (no biopsy). TR4–TR5 indicate intermediate to high suspicion (biopsy if >1.0–1.5 cm).[12]
Follow-up and surveillance protocols
When imaging features suggest probable benignity but definitive characterization remains uncertain, structured surveillance provides a safe alternative to immediate biopsy. The Fleischner Society publishes evidence-based guidelines for pulmonary nodule follow-up based on size, density, and patient risk factors.[7]
For breast imaging, probably benign findings (BI-RADS 3) carry a <2% malignancy risk and are managed with 6-month follow-up imaging. Thyroid nodules classified as low suspicion undergo ultrasound surveillance at 12–24 month intervals.
When biopsy is unavoidable
Biopsy remains the gold standard when imaging features are suspicious, when a lesion grows on follow-up, or when clinical risk factors are high. Percutaneous core needle biopsy under imaging guidance (ultrasound, CT, or stereotactic) provides tissue for histopathological analysis with minimal invasiveness.
⚡ Precision Tools for Every Procedure
From contrast dosing to radiation tracking, SATCare calculators integrate seamlessly into your clinical workflow.
Explore SATPro Solutions →Frequently asked questions
Quick answers to common clinical queries. Expand each question for detailed guidance.
While imaging provides high statistical probability, a tissue biopsy analyzed under a microscope is typically required for definitive cellular diagnosis. Radiology identifies suspicious benign vs malignant radiology features, but only histopathology can confirm malignancy with certainty. Even lesions with classic malignant appearances occasionally prove benign on biopsy, and vice versa.
Spiculated margins refer to irregular, star-shaped or spiky borders extending from a mass into surrounding tissue. This pattern suggests invasive growth and is a classic sign radiologists flag for further diagnostic evaluation or biopsy. Spiculation results from desmoplastic reaction—fibrous tissue pulling inward as malignant cells invade adjacent structures.
The most reliable benign indicators include smooth, sharp, well-circumscribed borders; homogeneous internal texture; clear fluid contents in cysts; popcorn or diffuse calcification patterns; and stable size over serial scans for 2+ years. Lesions containing macroscopic fat (measuring <-20 HU on CT) are virtually always benign lipomas.
Malignant tumors typically show rapid, intense contrast enhancement due to abundant abnormal blood vessels (angiogenesis). Benign lesions usually enhance slowly, minimally, or not at all. Time-intensity curve analysis on MRI or CT further separates these patterns: benign lesions show persistent enhancement, while malignant lesions often demonstrate rapid washout.
Fine, pleomorphic, or linear branching calcifications in breast tissue raise suspicion for malignancy. In lung nodules, eccentric or stippled calcifications are concerning. Benign calcifications typically appear as popcorn, diffuse, central, or laminated patterns. The distribution, size, and morphology of calcifications provide powerful diagnostic clues across all modalities.
When imaging features strongly suggest benign characteristics, short-interval follow-up imaging confirms stability over time. A nodule or mass that remains unchanged for 2 years on CT or ultrasound is statistically proven benign, avoiding unnecessary invasive procedures. This approach is supported by guidelines from the Fleischner Society and the American College of Radiology.
Further reading
Topically related articles from the SATMED Health clinical library.
Conclusion
Distinguishing benign vs malignant radiology features is both an art and a science. Radiologists systematically evaluate shape, borders, internal texture, contrast enhancement, calcification patterns, and growth over time to estimate the probability of malignancy. While no single feature provides absolute certainty, the summation of multiple characteristics allows highly accurate risk stratification.
Understanding these principles helps patients interpret their reports with greater confidence. Terms like "well-circumscribed," "spiculated," and "heterogeneous enhancement" are not arbitrary jargon—they represent carefully observed biological behaviors with direct clinical implications. Standardized lexicons such as BI-RADS, Lung-RADS, and TI-RADS ensure that these observations translate into consistent, evidence-based management recommendations across institutions and practitioners.
Remember that imaging is a powerful tool but not infallible. When features are ambiguous, follow-up imaging or biopsy provides the definitive answer. The goal is always the same: to identify malignancy early while avoiding unnecessary intervention for benign conditions.
💉 Precision Dosing, Every Time
SATSyrninge safety syringes eliminate dosing variability and reduce contamination risk in high-volume imaging departments.
Learn About SATSyrninge →🩺 SATCare Clinical Calculators for Your Practice
Access integrated decision-support tools designed for interventional radiology and oncology teams.
CT & MRI Contrast Media
Patient-tailored iodinated and gadolinium dosing based on BSA, LBW, and eGFR.
Radiation Dosimetry
Patient-specific effective dose and organ dose estimates for CT, fluoroscopy, and nuclear medicine.
Interventional Procedure Dose
Real-time dose tracking and peak skin dose estimation for cardiac cath and angiography.
Occupational Exposure
Personnel dose monitoring, shielding effectiveness, and ALARA compliance tracking.
Environmental Monitoring
Shielding design, barrier thickness calculations, and controlled area zoning.
Explore All Calculators
Browse the full SATCare suite: contrast, dosimetry, interventional, occupational, and environmental tools.
References
- Sickles EA. Periodic mammographic follow-up of probably benign lesions: results in 3,184 consecutive cases. Radiology. 1991;179(2):463-468. doi:10.1148/radiology.179.2.2017973
- Kumar V, Abbas AK, Aster JC. Robbins Basic Pathology. 10th ed. Philadelphia: Elsevier; 2017.
- Horeweg N, van der Aalst CM, Thunnissen E, et al. Characteristics of lung cancers detected by computer tomography screening in the randomized NELSON trial. Am J Respir Crit Care Med. 2013;187(8):848-854. doi:10.1164/rccm.201209-1651OC
- Naidich DP, Bankier AA, MacMahon H, et al. Recommendations for the management of subsolid pulmonary nodules detected at CT: a statement from the Fleischner Society. Radiology. 2013;266(1):304-317. doi:10.1148/radiol.121202893
- Kuhl CK. The current status of breast MR imaging. Part I. Choice of technique, image interpretation, diagnostic accuracy, and transfer to clinical practice. Radiology. 2007;244(2):356-378. doi:10.1148/radiol.2442050756
- Hoang JK, Langer JE, Middleton WD, et al. Managing incidental thyroid nodules detected on imaging: white paper of the ACR Incidental Thyroid Findings Committee. J Am Coll Radiol. 2015;12(2):143-150. doi:10.1016/j.jacr.2014.09.032
- MacMahon H, Naidich DP, Goo JM, et al. Guidelines for management of incidental pulmonary nodules detected on CT images: from the Fleischner Society 2017. Radiology. 2017;284(1):228-243. doi:10.1148/radiol.2017161659
- Padhani AR, Liu G, Koh DM, et al. Diffusion-weighted magnetic resonance imaging as a cancer biomarker: consensus and recommendations. Neoplasia. 2009;11(2):102-125. doi:10.1593/neo.81328
- Goo JM, Im JG. CT of tuberculosis and nontuberculous mycobacterial infections. Radiol Clin North Am. 2002;40(1):73-87. doi:10.1016/s0033-8389(03)00042-9
- Boiselle PM, White CS. Newly recognized artifacts on maximum intensity projection images of low-dose CT: a source of false-positive and false-negative interpretations. AJR Am J Roentgenol. 2009;192(4):W183-W189. doi:10.2214/AJR.08.1684
- American College of Radiology. ACR BI-RADS Atlas: Breast Imaging Reporting and Data System. 5th ed. Reston, VA: ACR; 2013.
- Tessler FN, Middleton WD, Grant EG, et al. ACR Thyroid Imaging, Reporting and Data System (TI-RADS): white paper of the ACR TI-RADS Committee. J Am Coll Radiol. 2017;14(5):587-595. doi:10.1016/j.jacr.2017.01.046
Medical Review: This article was medically reviewed by Prof. Dr. Damien O'Neil, MD, PhD, Chief Medical Officer at SATMED Health, on 6 September 2026. Prof. O'Neil is a board-certified radiologist with 25+ years of experience in diagnostic and interventional imaging across Europe, the Middle East, and Africa.
Editorial Policy: All SATMED Health clinical content undergoes rigorous fact-checking against peer-reviewed literature, ACR guidelines, and Fleischner Society recommendations. We update articles quarterly or whenever new evidence changes clinical practice. Last updated: 6 September 2026.
Disclaimer: This article is intended for educational purposes and does not constitute medical advice. Always consult a qualified healthcare provider for interpretation of your personal imaging results and clinical decision-making.
🌍 SATMED Health — Trusted Across Regions
Premium interventional radiology consumables, radiation safety solutions, and clinical decision-support tools. Local distribution, global standards.
Contact Regional Distribution →